Momentum Standard Deviation | LyroRS
Overview
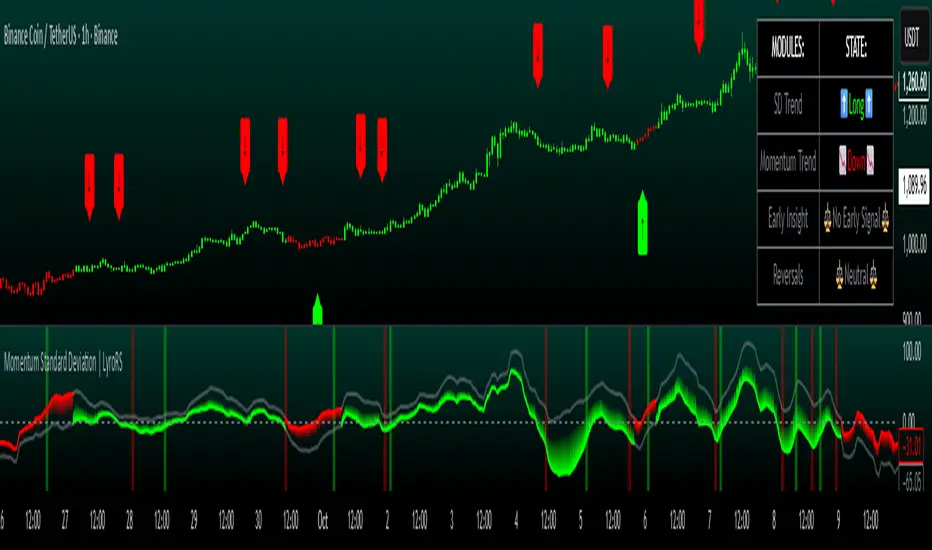
This indicator is designed to measure market momentum relative to standard deviation envelopes, while offering traders tools for identifying directional bias, valuation extremes, and early signals of potential reversals. By combining momentum with standard deviation analysis, smoothing functions, dynamic coloring, and table-based reporting, the script provides both a detailed and modular approach to momentum-based trading.
At its foundation, the indicator calculates momentum from a user-selected source, with optional smoothing applied through a variety of moving average types. Standard deviation is then measured around the momentum line to form upper and lower bands, which represent volatility-adjusted boundaries. These bands help identify whether momentum is overextended or trending strongly in a given direction. Signals are generated when momentum or its deviation bands cross key thresholds, with visual cues, background coloring, and plot shapes highlighting bullish or bearish shifts. A structured table summarizes the state of the system, including momentum trend, deviation trend, early insight conditions, and reversal signals, allowing traders to quickly interpret multiple layers of analysis.
Originality
In terms of originality, this script unifies momentum and standard deviation into a combined framework, rather than treating them as separate calculations. The ability to smooth source data, momentum, and deviation independently introduces flexibility, making it adaptable across assets and timeframes. Unique visualization features include futuristic-style fills, customizable color palettes, Heikin Ashi–like candle overlays, and dynamic table reporting. Together, these elements create a modular design that not only signals directional bias but also reports on context, such as early momentum flips and overbought/oversold reversals, which are often overlooked by standard momentum tools.
Key Features
- Moving average inputs allow users to choose the calculation source, enable smoothing, select from multiple moving average types, and adjust lengths for smoothing both price and momentum.
- Momentum settings define the lookback period and allow optional smoothing with user-specified averages.
- Standard deviation inputs include length, smoothing options, moving average type, and smoothing length, offering control over the sensitivity of volatility envelopes.
- Display options enable background coloring for early signals, reversal labels, momentum line plotting, and futuristic fills. Color schemes can be chosen from predefined palettes (Classic, Mystic, Accented, Royal) or set manually with custom bullish and bearish colors.
- Table settings include options for overlaying the table, positioning it anywhere on the chart, and adjusting table size from huge to tiny.
Visualization
Visualization includes upper and lower deviation bands, a smoothed average line, colored momentum plots, dynamic fills between bands, optional reversal arrows, and background shading for early insight conditions. The integrated table provides a concise breakdown of module states, showing whether deviation and momentum trends are bullish or bearish, whether an early momentum flip is detected, and whether reversals are signaled. Alerts are available for all conditions, including momentum and deviation direction changes, early signals, and bullish or bearish reversals.
Summary
In summary, the Momentum Standard Deviation indicator blends momentum and volatility analysis into a flexible, multi-layered tool. Its modular structure allows traders to analyze trends, volatility-adjusted overextensions, and early momentum shifts within one framework. With customizable smoothing, advanced visualization, integrated tables, and alert conditions, the indicator provides a structured method of tracking momentum states while remaining adaptable to different market conditions.
⚠️Disclaimer
This indicator is a tool for technical analysis and does not provide guaranteed results. It should be used in conjunction with other analysis methods and proper risk management practices. The creators of this indicator are not responsible for any financial decisions made based on its signals.
Script sob convite
Somente usuários aprovados pelo autor podem acessar este script. Você precisará solicitar e obter permissão para usá-lo. Normalmente, essa permissão é concedida após o pagamento. Para obter mais detalhes, siga as instruções do autor abaixo ou entre em contato diretamente com LyroRS.
A TradingView NÃO recomenda pagar ou usar um script, a menos que você confie totalmente em seu autor e entenda como ele funciona. Você também pode encontrar alternativas gratuitas e de código aberto em nossos scripts da comunidade.
Instruções do autor
Join our community: discord.gg/YUg8UxeRu8
All material from Lyro RS is for educational purposes only. Past performance does not guarantee future results.
Aviso legal
Script sob convite
Somente usuários aprovados pelo autor podem acessar este script. Você precisará solicitar e obter permissão para usá-lo. Normalmente, essa permissão é concedida após o pagamento. Para obter mais detalhes, siga as instruções do autor abaixo ou entre em contato diretamente com LyroRS.
A TradingView NÃO recomenda pagar ou usar um script, a menos que você confie totalmente em seu autor e entenda como ele funciona. Você também pode encontrar alternativas gratuitas e de código aberto em nossos scripts da comunidade.
Instruções do autor
Join our community: discord.gg/YUg8UxeRu8
All material from Lyro RS is for educational purposes only. Past performance does not guarantee future results.