OPEN-SOURCE SCRIPT
Atualizado WaveMacBoll
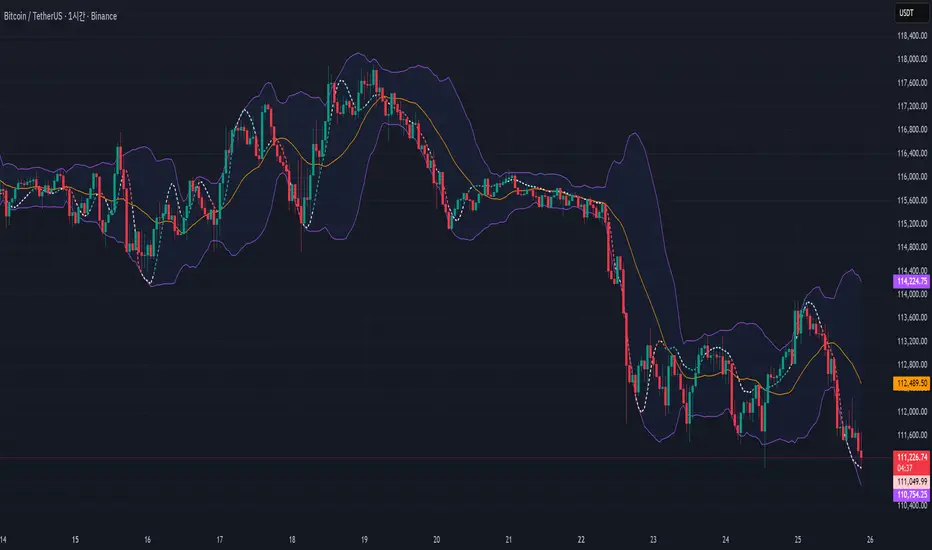
I wanted to see the two indicators in the candle chart, not in a separate window. And within the Bollinger band, it seemed to put it fine.
Important Note on Line Styles
Due to TradingView's multi-timeframe environment restrictions (timeframe = '', timeframe_gaps = true), I couldn't implement dotted or dashed line styles programmatically. The indicator uses solid lines by default.
If you prefer dotted/dashed lines for better visual distinction:
Add the indicator to your chart
Click on the indicator settings (gear icon)
Go to "Style" tab
Manually change line styles for each plot
Unfortunately, PineScript doesn't support line.new() or similar drawing functions in multi-timeframe mode, limiting our styling options to basic plot styles.
If you know a good solution for implementing dotted/dashed lines in multi-timeframe indicators without using drawing objects, please share it in the comments! I'd love to improve this aspect of the indicator
Notas de Lançamento
.Script de código aberto
Em verdadeiro espírito do TradingView, o criador deste script o tornou de código aberto, para que os traders possam revisar e verificar sua funcionalidade. Parabéns ao autor! Embora você possa usá-lo gratuitamente, lembre-se de que a republicação do código está sujeita às nossas Regras da Casa.
Aviso legal
As informações e publicações não se destinam a ser, e não constituem, conselhos ou recomendações financeiras, de investimento, comerciais ou de outro tipo fornecidos ou endossados pela TradingView. Leia mais nos Termos de Uso.
Script de código aberto
Em verdadeiro espírito do TradingView, o criador deste script o tornou de código aberto, para que os traders possam revisar e verificar sua funcionalidade. Parabéns ao autor! Embora você possa usá-lo gratuitamente, lembre-se de que a republicação do código está sujeita às nossas Regras da Casa.
Aviso legal
As informações e publicações não se destinam a ser, e não constituem, conselhos ou recomendações financeiras, de investimento, comerciais ou de outro tipo fornecidos ou endossados pela TradingView. Leia mais nos Termos de Uso.