OPEN-SOURCE SCRIPT
SOPR | Rocheur

Introducing Rocheur’s SOPR Indicator
The Spent Output Profit Ratio (SOPR) indicator by Rocheur is a powerful tool designed for analyzing Bitcoin market dynamics using on-chain data. By leveraging SOPR data and smoothing it through short- and long-term moving averages, this indicator provides traders with valuable insights into market behavior, helping them identify trends, reversals, and potential trading opportunities.
The Spent Output Profit Ratio (SOPR) indicator by Rocheur is a powerful tool designed for analyzing Bitcoin market dynamics using on-chain data. By leveraging SOPR data and smoothing it through short- and long-term moving averages, this indicator provides traders with valuable insights into market behavior, helping them identify trends, reversals, and potential trading opportunities.
- Understanding SOPR and Its Role in Trading
SOPR is a metric derived from on-chain data that measures the profit or loss of spent outputs on the Bitcoin network. It reflects the behavior of market participants based on the price at which Bitcoin was last moved. When SOPR is above 1, it indicates that outputs are being spent at a profit. Conversely, values below 1 suggest that outputs are being spent at a loss.
Rocheur’s SOPR indicator enhances this raw data by incorporating short-term and long-term smoothed trends, allowing traders to observe shifts in market sentiment and momentum. - How It Works
Data Source: The indicator uses SOPR data from Glassnode’s BTC_SOPR metric, updated daily.
Short-Term Trend (STH SOPR):
A Double Exponential Moving Average (DEMA) is applied over a customizable short-term length (default: 150 days).
This reflects recent market participant behavior.
Long-Term Trend (1-Year SOPR):
A Weighted Moving Average (WMA) is applied over a customizable long-term length (default: 365 days).
This captures broader market trends and investor behavior.
Trend Comparison:
Bullish Market: When STH SOPR exceeds the 1-year SOPR, the market is considered bullish.
Bearish Market: When STH SOPR falls below the 1-year SOPR, the market is considered bearish.
Neutral Market: When the two values are equal, the market is neutral. - Visual Representation
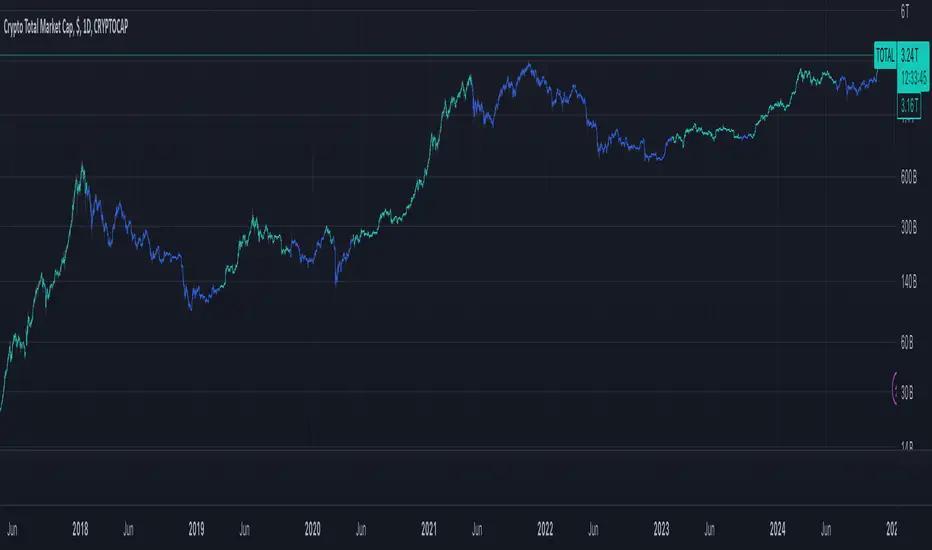
The indicator provides a color-coded visual representation for easy trend identification:
Green Bars: Indicate a bullish market where STH SOPR is above the 1-year SOPR.
Red Bars: Represent a bearish market where STH SOPR is below the 1-year SOPR.
Gray Bars: Show a neutral market condition where STH SOPR equals the 1-year SOPR.
The dynamic bar coloring allows traders to quickly assess the prevailing market sentiment and adjust their strategies accordingly. - Customization & Parameters
The SOPR Indicator offers several customizable settings to adapt to different trading styles and preferences:
Short-Term Length: Default set to 150 days, defines the smoothing period for the STH SOPR.
Long-Term Length: Default set to 365 days, defines the smoothing period for the 1-year SOPR.
Color Modes: Choose from seven distinct color schemes to personalize the indicator’s appearance. - Final Note
Rocheur’s SOPR Indicator is a unique tool that combines on-chain data with technical analysis to provide actionable insights for Bitcoin traders. Its ability to blend short- and long-term trends with a visually intuitive interface makes it an invaluable resource for navigating market dynamics. As with all indicators, backtesting and integration into a comprehensive strategy are essential for optimizing performance.
Aviso legal
As informações e publicações não devem ser e não constituem conselhos ou recomendações financeiras, de investimento, de negociação ou de qualquer outro tipo, fornecidas ou endossadas pela TradingView. Leia mais em Termos de uso.