Gauss Indicator
Class: oscillator
Trading type: any
Time frame: any
Purpose: reversal trading
Level of aggressiveness: any
About Gauss Indicator
Time series forecasting is quite a scientific task, for which specific econometrical models and methods have been developed.
Who is Gauss and Why his Curve is So Important
Johann Gauss was one of the best mathematicians of all times and he gave us a very specific curve (Gaussian Curve) to explain specifics of random variable behavior (so called Normal Distribution)
Gaussian curve has quite interesting property usually called “3 Sigmas Rule”: in a normal distribution: 68%, 95%, and 99.7% of the values lie within one, two, and three standard deviations of the mean, respectively.
But Does It Work in the Financial Markets?
Normal Distribution is extremely typical for price behavior in financial markets: FOREX, stock Market, Commodities, Cryptocurrency market.
How can we forecast future prices based on “3 Sigmas Rule”?
If we know past prices (we actually know), we can calculate Mean and Standard Deviation.
After that following “3 Sigmas Rules” we can calculate the fluctuations range for the present day with a known probability (!).
• If we add 1 sigma to mean we can get the price value that wouldn’t be exceeded with a probability of 68%.
• If we add 2 sigmas to mean we can get the price value that wouldn’t be exceeded with a probability of 95%.
• If we add 3 sigmas to mean we can get the price value that wouldn’t be exceeded with a probability of 99%.
How Can I Get This Information?
Gauss indicator is a practical implementation of “3 sigmas rule” in trading.
Gauss allows to predict the ranges of price fluctuations for the selected time frames (week, day, hour, etc) with certain probabilities: 68%, 95% and 99%.
Gauss can be used to generate Trading signals, Stop-loss parameters, Take-profit parameters, Synthetic Levels (both Support and Resistance).
Actually, ALL information you need to trade.
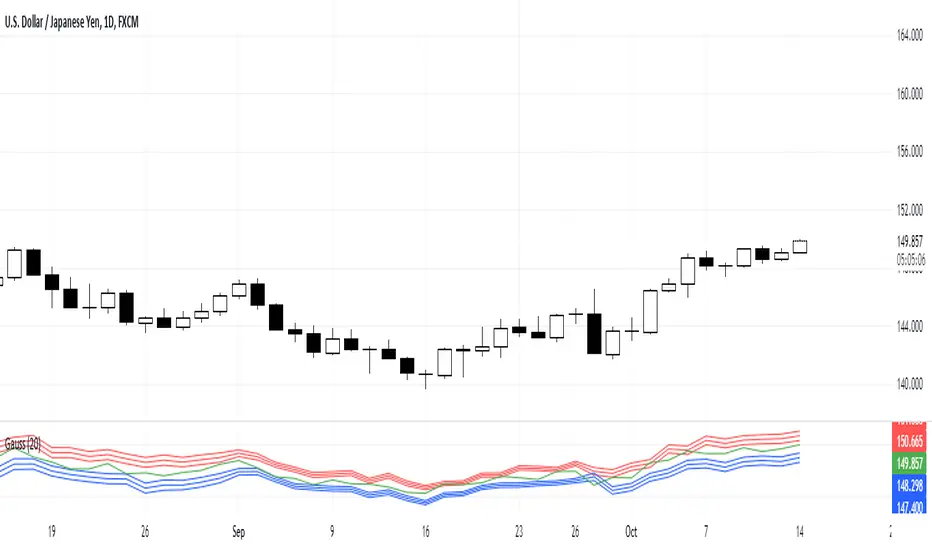
Structure of the Gauss Indicator
1. Three blue lines – synthetic support lines. They describe 3 different buy zones with certain probabilities of success:
- First blue line (Buy zone #1) - the price today will not fall below this mark with a probability of 68%;
- Second blue line (Buy zone #2)- the price today will not fall below this mark with a probability of 95%;
- Third blue line (Buy zone #3) - the price today will not fall below this mark with a probability of 99%.
2. Three red lines – synthetic resistance lines. They describe 3 different sell zones with certain probabilities of success:
- First red line (Sell zone #1) - the price today will not rise above this mark with a probability of 68%;
- Second red line (Sell zone #2) - the price today will not rise above this mark with a probability of 95%;
- Third red line (Sell zone #3) - the price today will not rise above this mark with a probability of 99%.
3. Green line – shows current price. When it gets close to the red/blue line sell/buy signals are generated.
Trading rules
General rules are as follows: buy at the blue lines, sell at the red lines.
Take-profits for sells are set at the nearest blue line, for buys – at the nearest red line. Stop-losses for sells are set above the last red line, for buys – below the last blue line.
Script sob convite
Somente usuários aprovados pelo autor podem acessar este script. Você precisará solicitar e obter permissão para usá-lo. Normalmente, essa permissão é concedida após o pagamento. Para obter mais detalhes, siga as instruções do autor abaixo ou entre em contato diretamente com KenJi_Indicator_2.
A TradingView NÃO recomenda pagar ou usar um script, a menos que você confie totalmente em seu autor e entenda como ele funciona. Você também pode encontrar alternativas gratuitas e de código aberto em nossos scripts da comunidade.
Instruções do autor
Aviso legal
Script sob convite
Somente usuários aprovados pelo autor podem acessar este script. Você precisará solicitar e obter permissão para usá-lo. Normalmente, essa permissão é concedida após o pagamento. Para obter mais detalhes, siga as instruções do autor abaixo ou entre em contato diretamente com KenJi_Indicator_2.
A TradingView NÃO recomenda pagar ou usar um script, a menos que você confie totalmente em seu autor e entenda como ele funciona. Você também pode encontrar alternativas gratuitas e de código aberto em nossos scripts da comunidade.