OPEN-SOURCE SCRIPT
NSDT Auto Fib Support / Resistance Levels
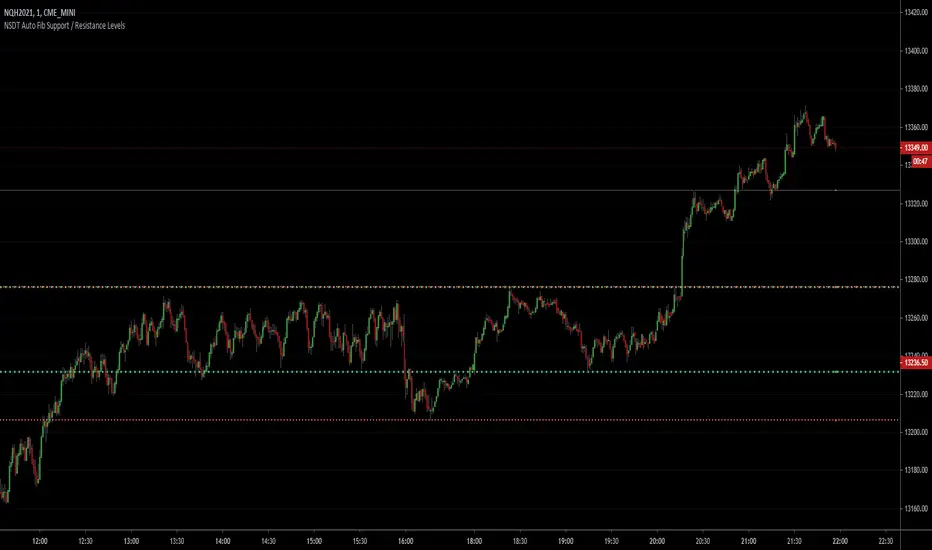
This script automatically plots support and resistance lines using the fib numbers as the amount of candles to lookback. Each line is colored differently to easily identify the support/resistance pair (i.e. 23%, 38%, 61%, etc..) with the 50% (Green) and 78% (Red) a thicker line. All variables are editable. Added alert capability.
Script de código aberto
Em verdadeiro espírito do TradingView, o criador deste script o tornou de código aberto, para que os traders possam revisar e verificar sua funcionalidade. Parabéns ao autor! Embora você possa usá-lo gratuitamente, lembre-se de que a republicação do código está sujeita às nossas Regras da Casa.
ALL indicators, strategies and bots are included with Discord access.
NorthStarDayTrading.com/discord
youtube.com/shorts/fWFQE7uEHvU
NorthStarDayTrading.com/discord
youtube.com/shorts/fWFQE7uEHvU
Aviso legal
As informações e publicações não se destinam a ser, e não constituem, conselhos ou recomendações financeiras, de investimento, comerciais ou de outro tipo fornecidos ou endossados pela TradingView. Leia mais nos Termos de Uso.