RSI Levels
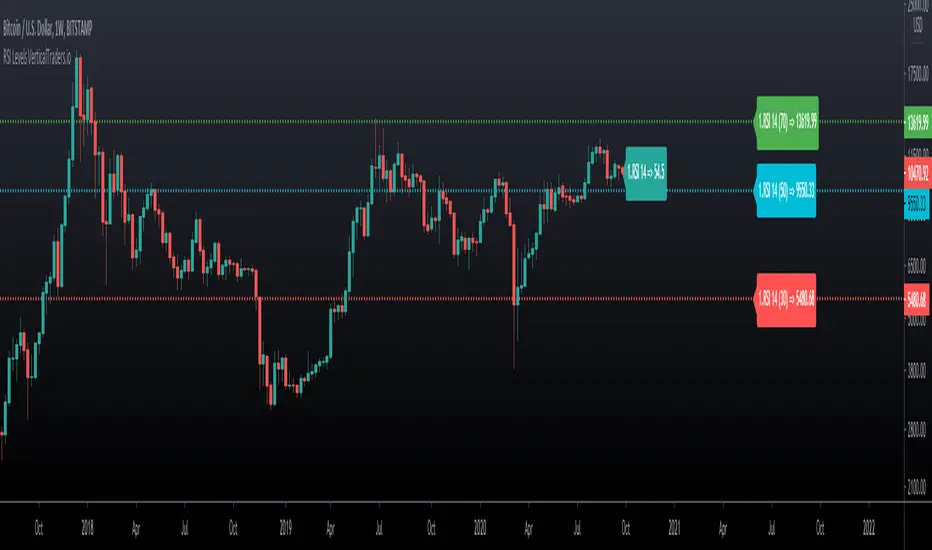
- The relative strength index ( RSI ) is a technical indicator used in the analysis of financial markets.
It is intended to chart the current and historical strength or weakness of a stock or market based on the closing prices of a recent trading period.
- This indicator allows us to visualize the levels of rsi in the chart, so that we can calculate take profit and stop points in a simple way,
knowing what position the price is currently in relation to these levels and how much space we have.
- We can also visualize the slope of the three levels of rsi , overbought, oversold and level 50, something that is not possible in the oscillator version.
- It allows you to display 2 rsi values at the same time.
- Allows to change the color of candlesticks based on rsi.
Script sob convite
Somente usuários autorizados pelos autores tem acesso a esses scripts, e isso normalmente requer pagamento. Você pode adicionar o script aos seus favoritos, mas você será capaz somente para usar ele depois de solicitar permissão e permiti-lo do seu autor — saiba mais aqui. Para mais detalhes, siga as instruções dos autores abaixo ou contate Vertical-X diretamente.
O TradingView NÃO recomenda pagar ou usar um script ao não ser que você confie totalmente no seu autor e compreende como isso funciona. Você pode também encontrar alternativas gratuitas e de código aberto em nossa comunidade de scripts.
Instruções do autor
Aviso: leia nosso guia para scritps somente sob convite antes de solicitar acesso.
Aviso legal
Script sob convite
Somente usuários autorizados pelos autores tem acesso a esses scripts, e isso normalmente requer pagamento. Você pode adicionar o script aos seus favoritos, mas você será capaz somente para usar ele depois de solicitar permissão e permiti-lo do seu autor — saiba mais aqui. Para mais detalhes, siga as instruções dos autores abaixo ou contate Vertical-X diretamente.
O TradingView NÃO recomenda pagar ou usar um script ao não ser que você confie totalmente no seu autor e compreende como isso funciona. Você pode também encontrar alternativas gratuitas e de código aberto em nossa comunidade de scripts.
Instruções do autor
Aviso: leia nosso guia para scritps somente sob convite antes de solicitar acesso.