OPEN-SOURCE SCRIPT
Currency Volatility Index (CVI)
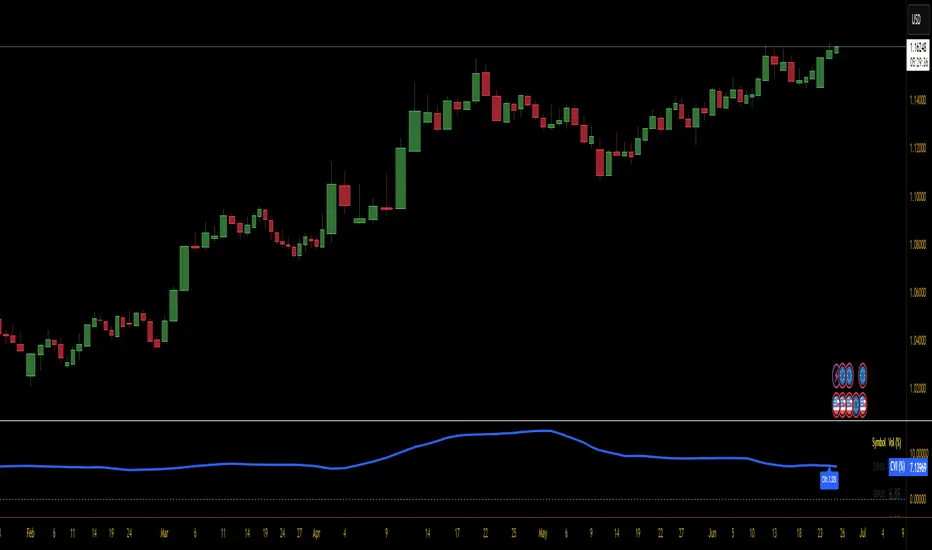
This Currency Volatility Index (CVI) indicator aggregates the realized volatility of the eight “major” FX pairs into a single, tradable series—much like an FX-version of the VIX. Here’s what it does step by step:
Inputs & Settings
• Volatility Length (default 20 days): the lookback over which daily log-returns’ standard deviation is computed.
• Data Timeframe (default Daily): the resolution at which price data is fetched for each pair.
• Smoothing Length (default 5): the period of a simple moving average applied to the raw, averaged volatility (in %).
Pair-by-Pair Volatility Calculation
For each hard-coded symbol (EURUSD, GBPUSD, USDJPY, USDCHF, AUDUSD, USDCAD, NZDUSD, EURGBP):
Aggregation
The eight annualized volatilities are averaged (equal weights).
The resulting number is then multiplied by 100 to express it as a percentage.
Smoothing & Plotting
A simple moving average over the aggregated volatility smooths out spikes.
The smoothed CVI (%) is plotted as a standalone line below price charts.
Visualization Aids
A small table in the top-right corner shows each pair’s current volatility in percent.
A dynamic label on the final bar prints the latest CVI value directly on the chart.
Why use it?
Gives a one-stop measure of overall FX market turbulence.
Helps you compare “quiet” vs. “volatile” regimes across currencies.
Inputs & Settings
• Volatility Length (default 20 days): the lookback over which daily log-returns’ standard deviation is computed.
• Data Timeframe (default Daily): the resolution at which price data is fetched for each pair.
• Smoothing Length (default 5): the period of a simple moving average applied to the raw, averaged volatility (in %).
Pair-by-Pair Volatility Calculation
For each hard-coded symbol (EURUSD, GBPUSD, USDJPY, USDCHF, AUDUSD, USDCAD, NZDUSD, EURGBP):
- Pull the series of daily closes.
- Compute the series of log-returns: ln(today’s close / yesterday’s close).
- Calculate the standard deviation of those log-returns over your lookback.
- Annualize it (×√252) to convert daily volatility into an annualized figure.
Aggregation
The eight annualized volatilities are averaged (equal weights).
The resulting number is then multiplied by 100 to express it as a percentage.
Smoothing & Plotting
A simple moving average over the aggregated volatility smooths out spikes.
The smoothed CVI (%) is plotted as a standalone line below price charts.
Visualization Aids
A small table in the top-right corner shows each pair’s current volatility in percent.
A dynamic label on the final bar prints the latest CVI value directly on the chart.
Why use it?
Gives a one-stop measure of overall FX market turbulence.
Helps you compare “quiet” vs. “volatile” regimes across currencies.
Script de código aberto
Em verdadeiro espírito do TradingView, o criador deste script o tornou de código aberto, para que os traders possam revisar e verificar sua funcionalidade. Parabéns ao autor! Embora você possa usá-lo gratuitamente, lembre-se de que a republicação do código está sujeita às nossas Regras da Casa.
Aviso legal
The information and publications are not meant to be, and do not constitute, financial, investment, trading, or other types of advice or recommendations supplied or endorsed by TradingView. Read more in the Terms of Use.