OPEN-SOURCE SCRIPT
Atualizado Rate of Change w/ Moving Average
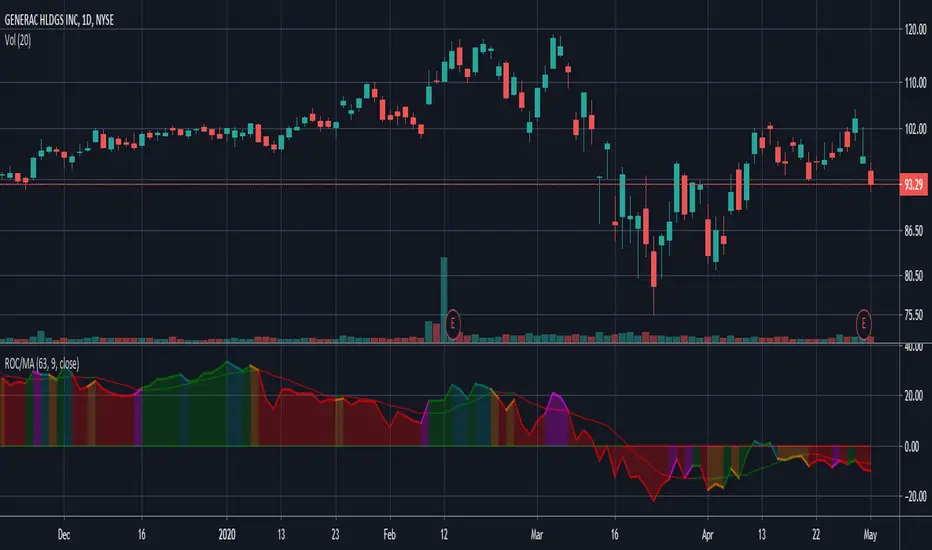
This is a small spin on the Rate of Change (ROC) indicator where I overlay a simple moving average of the indicator over the prior days.
Notas de Lançamento
Adjusted the color of the area underneath or above the curve to be green or red depending on whether the ROC is greater than or less than the SMA of the ROC.Notas de Lançamento
Altered colors so that the SMA is green when positive and red when negative in a way that's unrelated to the ROC value.Notas de Lançamento
Color the horizontal zero line axis green or red dependent upon whether the ROC is positive or negative so there is an indication on the base indicator crossover point.Notas de Lançamento
Added two additional signal states:- a cooling uptrend when the ROC falls below a rising moving average with a default color of light blue to look like an icy wind
- a recovering downtrend when the ROC rises above a falling moving average with a default color of purple to look like a forming bruise
Script de código aberto
Em verdadeiro espírito do TradingView, o criador deste script o tornou de código aberto, para que os traders possam revisar e verificar sua funcionalidade. Parabéns ao autor! Embora você possa usá-lo gratuitamente, lembre-se de que a republicação do código está sujeita às nossas Regras da Casa.
Aviso legal
As informações e publicações não se destinam a ser, e não constituem, conselhos ou recomendações financeiras, de investimento, comerciais ou de outro tipo fornecidos ou endossados pela TradingView. Leia mais nos Termos de Uso.