OPEN-SOURCE SCRIPT
Custom Fibonacci Strategy
Custom Fibonacci Strategy:
This strategy relies on analyzing Fibonacci levels to identify entry points for trades. It works by identifying peaks and troughs over a specified time period (50 bars in this code). Here are the steps of the strategy:
Identifying Peaks and Troughs:
The highest peak and lowest trough over the last 50 bars are identified.
If the price exceeds the previous peak, it is considered a break of the peak.
If the price falls below the previous trough after breaking the peak, it is considered a break of the trough.
Calculating Fibonacci Levels:
The 50% level (midway point) between the identified peak and trough is calculated.
Buy Signals:
When a trough is broken, and the price trades at or below the 50% level, the risk-to-reward ratio is evaluated.
If the risk-to-reward ratio is greater than or equal to 2, a buy signal is generated.
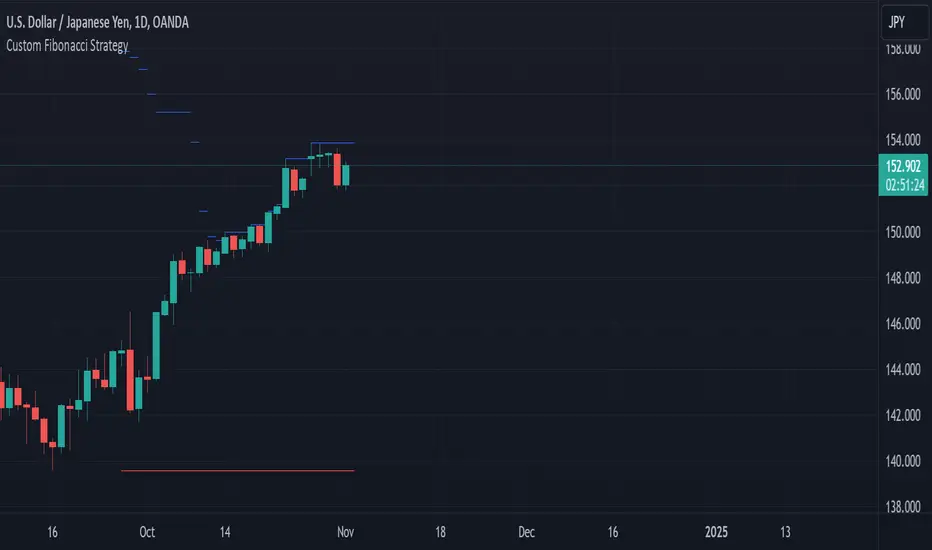
Displaying Levels:
Horizontal lines are displayed on the chart to illustrate the peak, trough, and Fibonacci level.
Summary
This strategy provides a systematic approach to trading based on Fibonacci retracement levels and price action, allowing traders to make informed decisions about entry points and manage risk effectively.
This strategy relies on analyzing Fibonacci levels to identify entry points for trades. It works by identifying peaks and troughs over a specified time period (50 bars in this code). Here are the steps of the strategy:
Identifying Peaks and Troughs:
The highest peak and lowest trough over the last 50 bars are identified.
If the price exceeds the previous peak, it is considered a break of the peak.
If the price falls below the previous trough after breaking the peak, it is considered a break of the trough.
Calculating Fibonacci Levels:
The 50% level (midway point) between the identified peak and trough is calculated.
Buy Signals:
When a trough is broken, and the price trades at or below the 50% level, the risk-to-reward ratio is evaluated.
If the risk-to-reward ratio is greater than or equal to 2, a buy signal is generated.
Displaying Levels:
Horizontal lines are displayed on the chart to illustrate the peak, trough, and Fibonacci level.
Summary
This strategy provides a systematic approach to trading based on Fibonacci retracement levels and price action, allowing traders to make informed decisions about entry points and manage risk effectively.
Script de código aberto
Em verdadeiro espírito do TradingView, o criador deste script o tornou de código aberto, para que os traders possam revisar e verificar sua funcionalidade. Parabéns ao autor! Embora você possa usá-lo gratuitamente, lembre-se de que a republicação do código está sujeita às nossas Regras da Casa.
Aviso legal
As informações e publicações não se destinam a ser, e não constituem, conselhos ou recomendações financeiras, de investimento, comerciais ou de outro tipo fornecidos ou endossados pela TradingView. Leia mais nos Termos de Uso.