PROTECTED SOURCE SCRIPT
Scalperstool v1.0_Ramesh0296
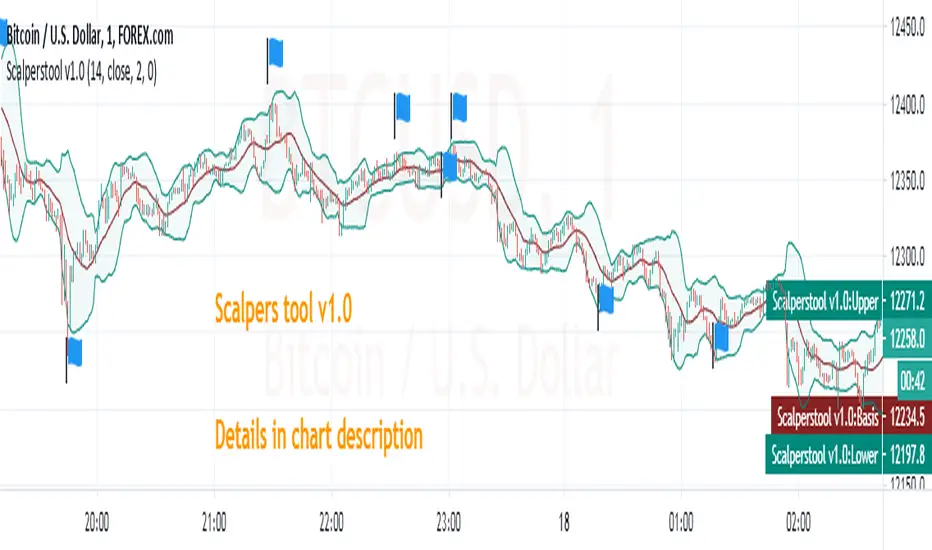
Scalperstool v1.0
This indicator can use for scalp in Highly liquid stocks,indices and currencies
What here i used ?
Here i used Bollinger bands with Modified Relative Strength Index (n=2)
How to use it ?
Apply scalperstool v1.0 in chart
Time frame 1min
once you applied 3 lines will plotted on chart but the value dimensions shows 4 value in top left side on the chart
first 3 values related to bollinger bands(here i used it for dynamic support and resistance). the last value shows modified RSI value
CONDITIONS
CONDITION 1
1 min candle should close and it must showing below value
safe Players
Buy condition (too safe) : RSI value should be less than or equal to 3
Sell condition (too safe) : RSI value should be greater than or equal to 97
Moderate Risk takers
Buy condition : RSI value should be less than or equal to 10
Sell condition : RSI value should be greater than or equal to 90
Most of the time the value above mentioned equals to bollinger upper band(overbought) and lower band(oversold) zones
CONDITION 2
May scalp alone with 1st condition but my favorite is i combined above condition with this one
This is too simple that 1 min candle should close with long upper wick or long lower wick & mostly its open equals to high looks like a hammer but not exact one.
I flag some good trades in chart.
STOP LOSS SHOULD BE ENTRY CANDLE'S PREVIOUS ONE LOW OR HIGH.
--------------------------------------------------------------------------------------------------------------------------
LIKE & FOLLOW TO SHOW YOUR LOVE & SUPPORT AND ALSO TO GET MORE TRADE IDEAS AND SCRIPTS
**Educational Purpose only
Script protegido
Esse script é publicada como código fechado. No entanto, você pode gerenciar suas escolhas de bate-papo. Por favor, abra suas Configurações do perfil
Aviso legal
As informações e publicações não se destinam a ser, e não constituem, conselhos ou recomendações financeiras, de investimento, comerciais ou de outro tipo fornecidos ou endossados pela TradingView. Leia mais nos Termos de Uso.