OPEN-SOURCE SCRIPT
Relative Volume + Z-score + Normal Volume + Avg. Volume

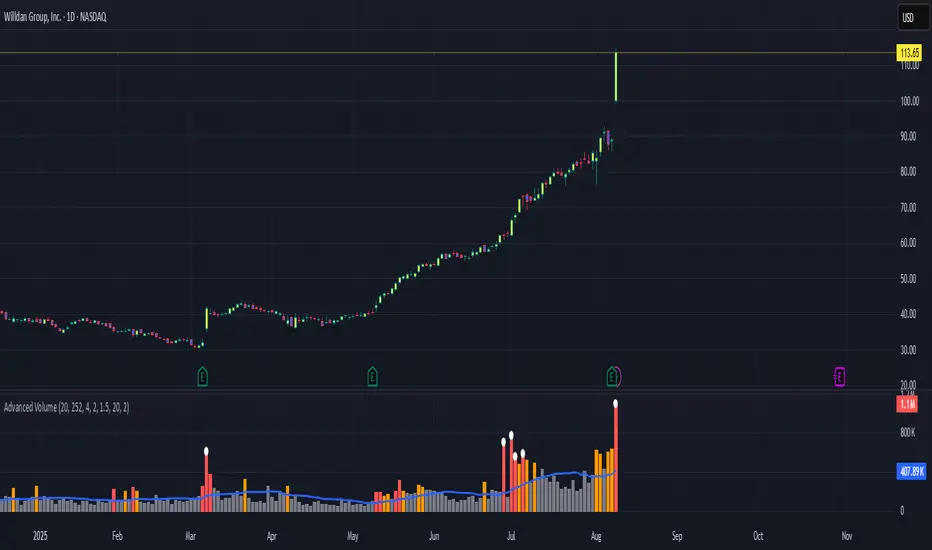
A statistical way to visualize volume analytically compared to traditional volume. All Lookback Periods and Colors can be changed so user can make it feel personalized
- Relative Volume (RVOL) visualizer with the color of the histogram bar changing to represent exceeding a threshold specified by the user
For example --> (1.5 = Orange Bar) & (2 = Red Bar)
- Toggle View between RVOL visualization of volume vs. normal view of volume plot
- Z score lookback for volume across specified lookback per what user wants (dot/symbol above the bar)
- Average Volume Plot
Script de código aberto
Em verdadeiro espírito do TradingView, o criador deste script o tornou de código aberto, para que os traders possam revisar e verificar sua funcionalidade. Parabéns ao autor! Embora você possa usá-lo gratuitamente, lembre-se de que a republicação do código está sujeita às nossas Regras da Casa.
Aviso legal
As informações e publicações não se destinam a ser, e não constituem, conselhos ou recomendações financeiras, de investimento, comerciais ou de outro tipo fornecidos ou endossados pela TradingView. Leia mais nos Termos de Uso.