OPEN-SOURCE SCRIPT
Atualizado multi-tf standard devs [keypoems]
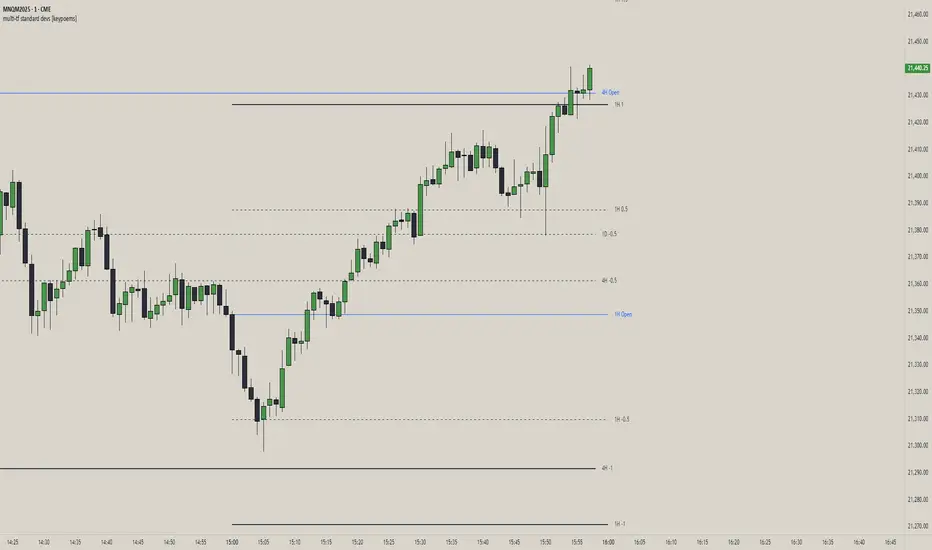
Multi-Timeframe Standard Deviations Levels
A visual map of “how far is too far” across any three higher time-frames.
1. What it does
This script plots dynamic price “rails” built from standard deviation (StDev)—the same math that underpins the bell curve—on up to three higher-time-frames (HTFs) at once.
• It measures the volatility of intraday open-to-close increments, reaching back as far as 5000 bars (≈ 20 years on daily data).
• Each HTF can be extended to the next session or truncated at session close for tidy dashboards.
• Lines can be mirrored so you see symmetric positive/negative bands, and optional background fills shade the “probability cone.”
Because ≈ 68 % of moves live inside ±1 StDev, ≈ 95 % inside ±2, and ≈ 99.7 % inside ±3, the plot instantly shows when price is statistically stretched or compressed.
3. Key settings
Higher Time-Frame #1-3 Turn each HTF on/off, pick the interval (anything from 1 min to 1 year), and decide whether lines should extend into the next period.
Show levels for last X days Keep your chart clean by limiting how many historical sessions are displayed (1-50).
Based on last X periods Length of the StDev sample. Long look-backs (e.g. 5 000) iron-out day-to-day noise; short look-backs make the bands flex with recent volatility.
Fib Settings Toggle each multiple, line thickness/style/colour, label size, whether to print the numeric level, the live price, the HTF label, and whether to tint the background (choose your own opacity).
4. Under-the-hood notes
StDev is calculated on (close – open) / open rather than absolute prices, making the band width scale-agnostic.
Watch for tests of ±1:
Momentum traders ride the breakout with a target at the next band.
Mean-reversion traders wait for the first stall candle and trade back to zero line or VWAP.
Bottom line: Multi-Timeframe Standard-Deviations turns raw volatility math into an intuitive “price terrain map,” helping you instantly judge whether a move is ordinary, stretched, or extreme—across the time-frames that matter to you.
Original code by fadizeidan and stats by NQStats's ProbableChris.
Notas de Lançamento
Changelog (internal version v16): - Bugfix: pruning of older periods fib levels now works according to settings.
Notas de Lançamento
Changelog: (internal version v30)- Fix memory leaks and refactor code to reduce memory footprint.
Script de código aberto
Em verdadeiro espírito do TradingView, o criador deste script o tornou de código aberto, para que os traders possam revisar e verificar sua funcionalidade. Parabéns ao autor! Embora você possa usá-lo gratuitamente, lembre-se de que a republicação do código está sujeita às nossas Regras da Casa.
Aviso legal
As informações e publicações não se destinam a ser, e não constituem, conselhos ou recomendações financeiras, de investimento, comerciais ou de outro tipo fornecidos ou endossados pela TradingView. Leia mais nos Termos de Uso.