OPEN-SOURCE SCRIPT
Atualizado BB Support & Resistance

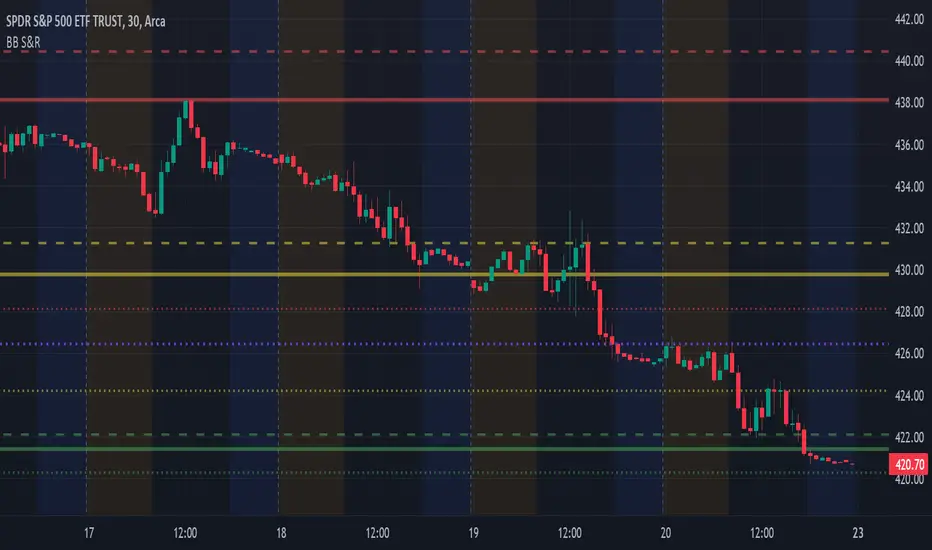
Choosing support and resistance can be time consuming and subjective. Personally, I don't want to spend too much time manually marking up charts. Credit to video I saw, forget the producer, that demonstrated how multi-time frame Bollinger Bands can act as support and resistance. I suggest reading up on Bollinger Bands (en.wikipedia.org/wiki/Bollinger_Bands) and how to trade them. This indicator draws support and resistance lines based on Bollinger Bands on three time frames. You can select 1 or all three time frames to display on your chart. Enjoy.
Notas de Lançamento
Choosing support and resistance can be time consuming and subjective. Personally, I don't want to spend too much time manually marking up charts. Credit to video I saw, forget the producer, that demonstrated how multi-time frame Bollinger Bands can act as support and resistance. I suggest reading up on Bollinger Bands (en.wikipedia.org/wiki/Bollinger Bands) and how to use them in your trading. This indicator draws support and resistance lines based on Bollinger Bands on three time frames. You can select 1 or all three time frames to display on your chart. Enjoy.Updated...Added option to set S&R line colors by time frame.
Script de código aberto
Em verdadeiro espírito do TradingView, o criador deste script o tornou de código aberto, para que os traders possam revisar e verificar sua funcionalidade. Parabéns ao autor! Embora você possa usá-lo gratuitamente, lembre-se de que a republicação do código está sujeita às nossas Regras da Casa.
Aviso legal
As informações e publicações não se destinam a ser, e não constituem, conselhos ou recomendações financeiras, de investimento, comerciais ou de outro tipo fornecidos ou endossados pela TradingView. Leia mais nos Termos de Uso.