OPEN-SOURCE SCRIPT
Atualizado Flexible Reversal Detector
Flexible Reversal Detector
An advanced, fully customizable analytical tool designed to identify local trend reversal zones based on candlestick formations. Users have full control over all logic parameters, making it adaptable to different trading styles and preferences.
Key Features
Adjustable maximum pattern length (number of candles)
Customizable body size ratios for initial, middle, and final candles
Configurable minimum price movement (in %) required before a pattern is considered valid
Colored horizontal lines showing the full length of the pattern – helpful in identifying structure, potential support/resistance zones
Optional volume filter – the volume of the final candle is compared to a volume SMA; multiplier can be adjusted (e.g. 1 = equal to average, 0.8 = 80% of average)
Logic Overview
U Pattern
Each bearish candle is treated as a potential start of a reversal pattern.
Subsequent candles, if small enough and within defined thresholds, form the middle part of the structure.
When a bullish candle with a sufficiently large body appears, it is marked as the final candle of the pattern.
The pattern is considered valid if it was preceded by a defined percentage price drop and – optionally – if the volume condition was met.
∩ Pattern
Each bullish candle may act as the initial candle of a potential reversal pattern in the opposite direction.
Following smaller candles form the middle part, as long as they meet the defined criteria.
The appearance of a strong bearish candle marks the end of the formation.
If this pattern is preceded by a certain price increase (and optionally meets the volume filter), it is highlighted on the chart.
Note: On markets with low volatility or on lower timeframes, it is recommended to reduce the percentage thresholds for signal detection. For more dynamic price action or higher timeframes, consider increasing them accordingly.
Visualization
The final candle of the pattern is marked visually on the chart (depending on direction)
Colored horizontal lines indicate the full span of the pattern – from initial to final candle
Notas de Lançamento
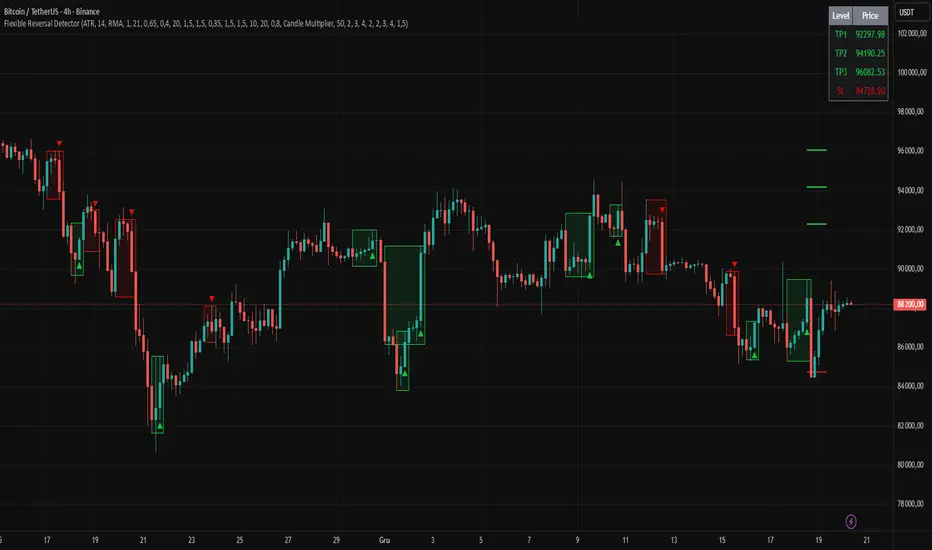
Replaced horizontal lines with boxes highlighting the entire formation — improved visualization of U and ∩ patterns.Notas de Lançamento
An ATR-based measurement mode has been added, eliminating the need to manually adjust move proportions for each timeframe or asset.Optional SL and TP levels were also introduced, along with a clear information table displaying the current values.
Script de código aberto
Em verdadeiro espírito do TradingView, o criador deste script o tornou de código aberto, para que os traders possam revisar e verificar sua funcionalidade. Parabéns ao autor! Embora você possa usá-lo gratuitamente, lembre-se de que a republicação do código está sujeita às nossas Regras da Casa.
Aviso legal
As informações e publicações não se destinam a ser, e não constituem, conselhos ou recomendações financeiras, de investimento, comerciais ou de outro tipo fornecidos ou endossados pela TradingView. Leia mais nos Termos de Uso.