OPEN-SOURCE SCRIPT
RSI-EMA-Crossing with Donchian-Stop-Loss

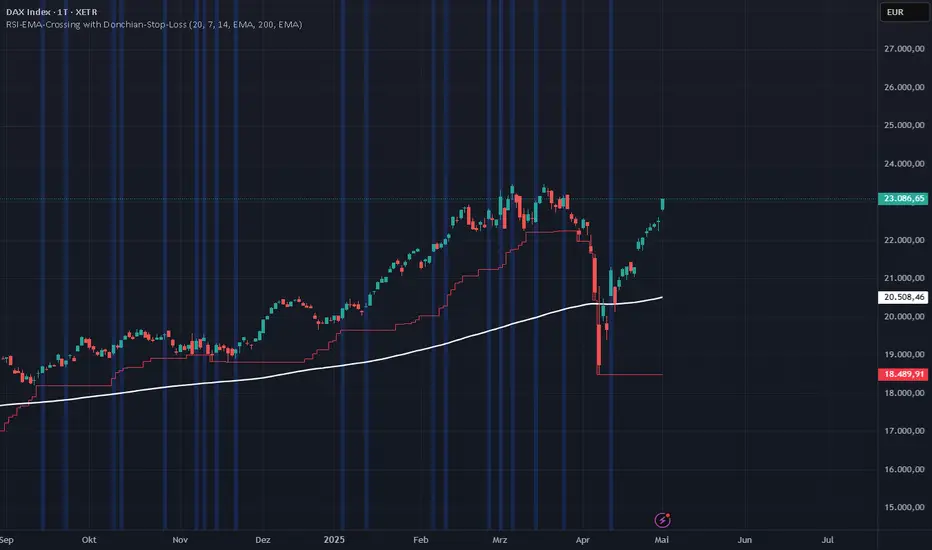
The Donchian RSI Indicator is a visual tool that combines momentum and trend analysis to identify high-quality long opportunities based on RSI crossovers, price action, and Donchian channel dynamics.
How It Works
Stop-Loss (Visual Only)
The lower band of the Donchian Channel acts as a visual reference for a dynamic stop-loss level.
Features
Use Case
Designed for swing and position traders
Optimized for use on daily or 4H charts
How It Works
- Momentum Signal: A bullish RSI crossover is detected when the RSI crosses above its moving average.
- Trend Filter: A signal is only valid if the crossover occurs while the price is above its moving average – filtering out entries against the prevailing trend.
- Signal Candle: The high of the crossover candle is stored.
- Entry Trigger: A valid signal occurs when a later candle closes above that signal high.
Stop-Loss (Visual Only)
The lower band of the Donchian Channel acts as a visual reference for a dynamic stop-loss level.
Features
- Customizable RSI, Donchian Channel, and moving average lengths
- Selectable MA types: SMA, EMA, WMA, VWMA, HMA
- Signal candle highlighted (yellow background)
- Entry points labeled on the chart
- Price MA and Donchian Channel plotted
- Trend filter improves signal quality by confirming upward bias
Use Case
Designed for swing and position traders
Optimized for use on daily or 4H charts
Script de código aberto
Em verdadeiro espírito do TradingView, o criador deste script o tornou de código aberto, para que os traders possam revisar e verificar sua funcionalidade. Parabéns ao autor! Embora você possa usá-lo gratuitamente, lembre-se de que a republicação do código está sujeita às nossas Regras da Casa.
Aviso legal
As informações e publicações não se destinam a ser, e não constituem, conselhos ou recomendações financeiras, de investimento, comerciais ou de outro tipo fornecidos ou endossados pela TradingView. Leia mais nos Termos de Uso.