OPEN-SOURCE SCRIPT
Total Return (divi reivested)
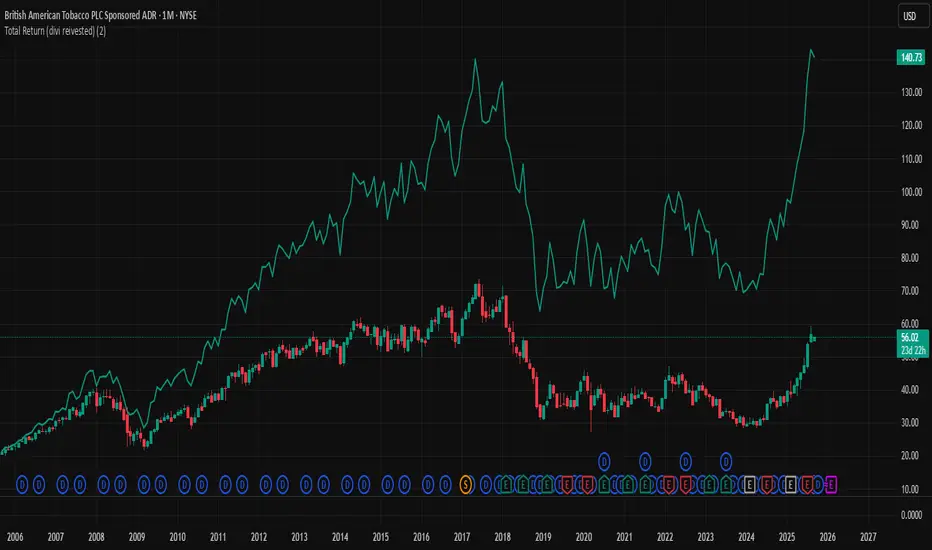
Total Return (Dividends Reinvested) — Price Scale
This indicator overlays a Total Return price line on the chart. It shows how the stock would have performed if all dividends had been reinvested back into the stock (buying fractional shares) rather than taken as cash.
The line starts exactly at the price level of the first visible bar on your chart and moves in the same price units as the chart (not indexed to 100).
Until the first dividend inside the visible window, the Total Return line is identical to the price. From the first dividend onward, it gradually diverges upwards, reflecting the effect of reinvested payouts.
Settings:
Reinvest at Open / Close — Choose whether reinvestment uses the bar’s open or close price.
Apply effect on the next bar — If enabled, reinvestment shows up from the bar after the dividend date (common in practice).
Show dividend markers — Optionally plots labels where dividend events occur.
Line width — Adjusts the thickness of the plotted Total Return line.
Use case:
This tool is useful if you want to compare plain price performance with true shareholder returns including dividends. It helps evaluate dividend stocks (like BTI, T, XOM, etc.) more realistically.
Script de código aberto
Em verdadeiro espírito do TradingView, o criador deste script o tornou de código aberto, para que os traders possam revisar e verificar sua funcionalidade. Parabéns ao autor! Embora você possa usá-lo gratuitamente, lembre-se de que a republicação do código está sujeita às nossas Regras da Casa.
Aviso legal
As informações e publicações não se destinam a ser, e não constituem, conselhos ou recomendações financeiras, de investimento, comerciais ou de outro tipo fornecidos ou endossados pela TradingView. Leia mais nos Termos de Uso.