MM Money Flow Index
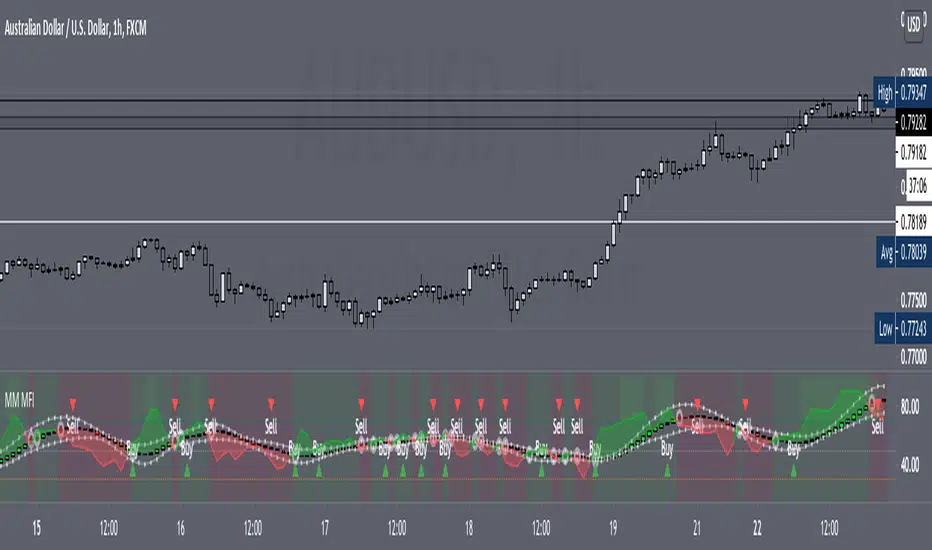
How this indicator works
Oversold levels typically occur below 20 and overbought levels typically occur above 80. These levels may change depending on market conditions. Level lines should cut across the highest peaks and the lowest troughs. Oversold/Overbought levels are generally not reason enough to buy/sell; and traders should consider additional technical analysis or research to confirm the security's turning point. Keep in mind, during strong trends, the MFI may remain overbought or oversold for extended periods.
If the underlying price makes a new high or low that isn't confirmed by the MFI, this divergence can signal a price reversal.
Calculation
The Money Flow Index requires a series of calculations.
First, the period's Typical Price is calculated.
Typical Price = (High + Low + Close)/3
Next, Money Flow (not the Money Flow Index) is calculated by multiplying the period's Typical Price by the volume.
Money Flow = Typical Price * Volume
If today's Typical Price is greater than yesterday's Typical Price, it is considered Positive Money Flow. If today's price is less, it is considered Negative Money Flow.
Positive Money Flow is the sum of the Positive Money over the specified number of periods.
Negative Money Flow is the sum of the Negative Money over the specified number of periods.
The Money Ratio is then calculated by dividing the Positive Money Flow by the Negative Money Flow.
Money Ratio = Positive Money Flow / Negative Money Flow
Finally, the Money Flow Index is calculated using the Money Ratio.
Script sob convite
Somente usuários autorizados pelos autores tem acesso a esses scripts, e isso normalmente requer pagamento. Você pode adicionar o script aos seus favoritos, mas você será capaz somente para usar ele depois de solicitar permissão e permiti-lo do seu autor — saiba mais aqui. Para mais detalhes, siga as instruções dos autores abaixo ou contate MoneyMovesInvestments diretamente.
O TradingView NÃO recomenda pagar ou usar um script ao não ser que você confie totalmente no seu autor e compreende como isso funciona. Você pode também encontrar alternativas gratuitas e de código aberto em nossa comunidade de scripts.
Instruções do autor
Aviso: leia nosso guia para scritps somente sob convite antes de solicitar acesso.
Aviso legal
Script sob convite
Somente usuários autorizados pelos autores tem acesso a esses scripts, e isso normalmente requer pagamento. Você pode adicionar o script aos seus favoritos, mas você será capaz somente para usar ele depois de solicitar permissão e permiti-lo do seu autor — saiba mais aqui. Para mais detalhes, siga as instruções dos autores abaixo ou contate MoneyMovesInvestments diretamente.
O TradingView NÃO recomenda pagar ou usar um script ao não ser que você confie totalmente no seu autor e compreende como isso funciona. Você pode também encontrar alternativas gratuitas e de código aberto em nossa comunidade de scripts.
Instruções do autor
Aviso: leia nosso guia para scritps somente sob convite antes de solicitar acesso.