PROTECTED SOURCE SCRIPT
ATR - FS
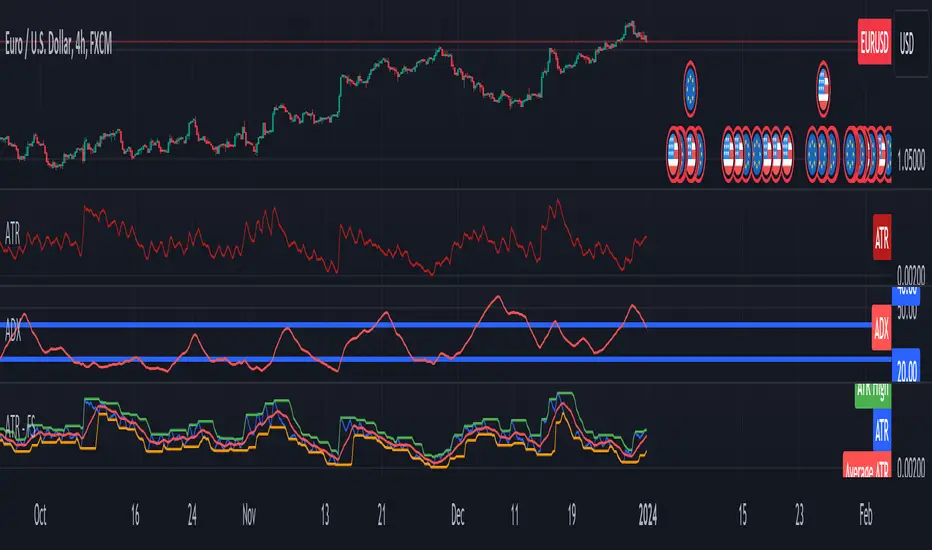
This script calculates and visualizes the Average True Range (ATR) along with its moving average, highest, and lowest values over a defined period. The ATR is a widely used volatility indicator in trading that measures the degree of price movement within a market. By incorporating both the average ATR and the high/low ranges, this script provides a comprehensive view of market volatility dynamics.
Use Cases:
Volatility-Based Trading:
Traders can use this indicator to gauge market volatility and adjust their trading strategies accordingly. For example:
During high volatility periods (high ATR values), traders might widen their stop-loss levels to accommodate larger price swings.
Conversely, during low volatility periods, traders may tighten their stop-loss levels to capture profits before the market moves against them.
Trend Identification:
The moving average of ATR helps traders identify long-term volatility trends, which can indicate the strength of a market trend:
Volatility Breakouts:
By analyzing the highest and lowest ATR values, traders can spot potential breakout opportunities:
Risk Management:
The ATR is a critical tool in risk management, helping traders set stop-losses and position sizes based on market conditions:
Use Cases:
Volatility-Based Trading:
Traders can use this indicator to gauge market volatility and adjust their trading strategies accordingly. For example:
- High ATR values often indicate periods of high volatility, suggesting larger price swings and more aggressive trading opportunities.
- Low ATR values signal quieter market conditions, where range-bound trading or less aggressive positioning might be favorable.
- Stop-Loss & Take-Profit Placement:
- The ATR is commonly used to determine optimal stop-loss and take-profit levels:
During high volatility periods (high ATR values), traders might widen their stop-loss levels to accommodate larger price swings.
Conversely, during low volatility periods, traders may tighten their stop-loss levels to capture profits before the market moves against them.
Trend Identification:
The moving average of ATR helps traders identify long-term volatility trends, which can indicate the strength of a market trend:
- If the average ATR is increasing, it could suggest the continuation of a strong trend.
- A decreasing average ATR may indicate the start of a consolidation period or weakening trend.
Volatility Breakouts:
By analyzing the highest and lowest ATR values, traders can spot potential breakout opportunities:
- A sudden spike in ATR (breaking above the green line) can indicate a breakout from a consolidation phase.
- Dropping below the orange line may signal a period of market stagnation or consolidation.
Risk Management:
The ATR is a critical tool in risk management, helping traders set stop-losses and position sizes based on market conditions:
- Higher ATR values might prompt a trader to reduce their position size to account for larger potential losses.
- Lower ATR values may encourage a trader to take on larger positions, as the market risk is lower.
Script protegido
Esse script é publicada como código fechado. No entanto, você pode gerenciar suas escolhas de bate-papo. Por favor, abra suas Configurações do perfil
Aviso legal
As informações e publicações não se destinam a ser, e não constituem, conselhos ou recomendações financeiras, de investimento, comerciais ou de outro tipo fornecidos ou endossados pela TradingView. Leia mais nos Termos de Uso.