OPEN-SOURCE SCRIPT
Rainbow MA- AYNET
Description
What it Does:
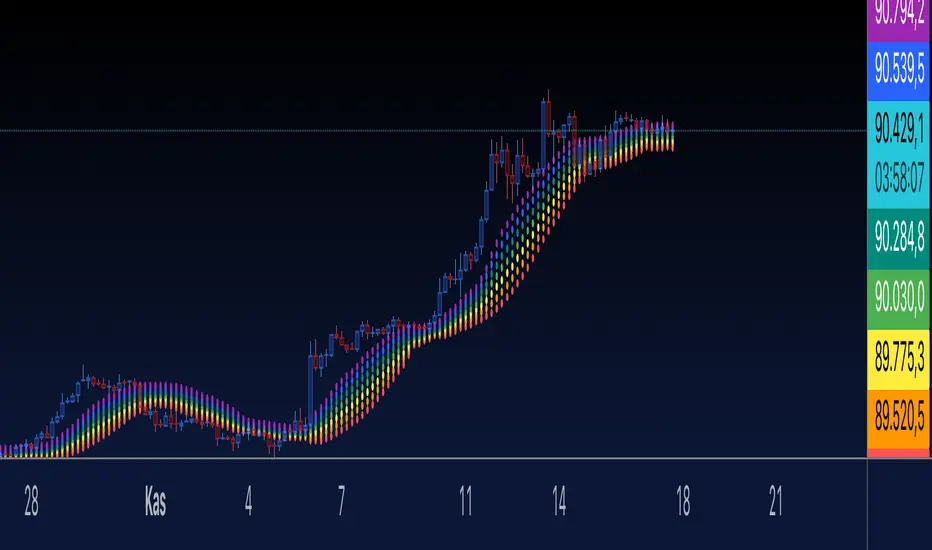
The Rainbow Indicator visualizes price action with a colorful "rainbow-like" effect.
It uses a moving average (SMA) and dynamically creates bands around it using standard deviation.
Features:
Seven bands are plotted, each corresponding to a different rainbow color (red to purple).
Each band is calculated using the moving average (ta.sma) and a smoothing multiplier (smooth) to control their spread.
User Inputs:
length: The length of the moving average (default: 14).
smooth: Controls the spacing between the bands (default: 0.5).
radius: Adjusts the size of the circular points (default: 3).
How it Works:
The bands are plotted above and below the moving average.
The offset for each band is calculated using standard deviation and a user-defined smoothing multiplier.
Plotting:
Each rainbow band is plotted individually using plot() with circular points (plot.style_circles).
Customization
You can modify the color palette, adjust the smoothing multiplier, or change the moving average length to suit your needs.
The number of bands can also be increased or decreased by adding/removing colors from the colors array and updating the loop.
If you have further questions or want to extend the indicator, let me know! 😊
What it Does:
The Rainbow Indicator visualizes price action with a colorful "rainbow-like" effect.
It uses a moving average (SMA) and dynamically creates bands around it using standard deviation.
Features:
Seven bands are plotted, each corresponding to a different rainbow color (red to purple).
Each band is calculated using the moving average (ta.sma) and a smoothing multiplier (smooth) to control their spread.
User Inputs:
length: The length of the moving average (default: 14).
smooth: Controls the spacing between the bands (default: 0.5).
radius: Adjusts the size of the circular points (default: 3).
How it Works:
The bands are plotted above and below the moving average.
The offset for each band is calculated using standard deviation and a user-defined smoothing multiplier.
Plotting:
Each rainbow band is plotted individually using plot() with circular points (plot.style_circles).
Customization
You can modify the color palette, adjust the smoothing multiplier, or change the moving average length to suit your needs.
The number of bands can also be increased or decreased by adding/removing colors from the colors array and updating the loop.
If you have further questions or want to extend the indicator, let me know! 😊
Script de código aberto
Em verdadeiro espírito do TradingView, o criador deste script o tornou de código aberto, para que os traders possam revisar e verificar sua funcionalidade. Parabéns ao autor! Embora você possa usá-lo gratuitamente, lembre-se de que a republicação do código está sujeita às nossas Regras da Casa.
Aviso legal
As informações e publicações não se destinam a ser, e não constituem, conselhos ou recomendações financeiras, de investimento, comerciais ou de outro tipo fornecidos ou endossados pela TradingView. Leia mais nos Termos de Uso.