PROTECTED SOURCE SCRIPT
OBV Oscillator [CP]
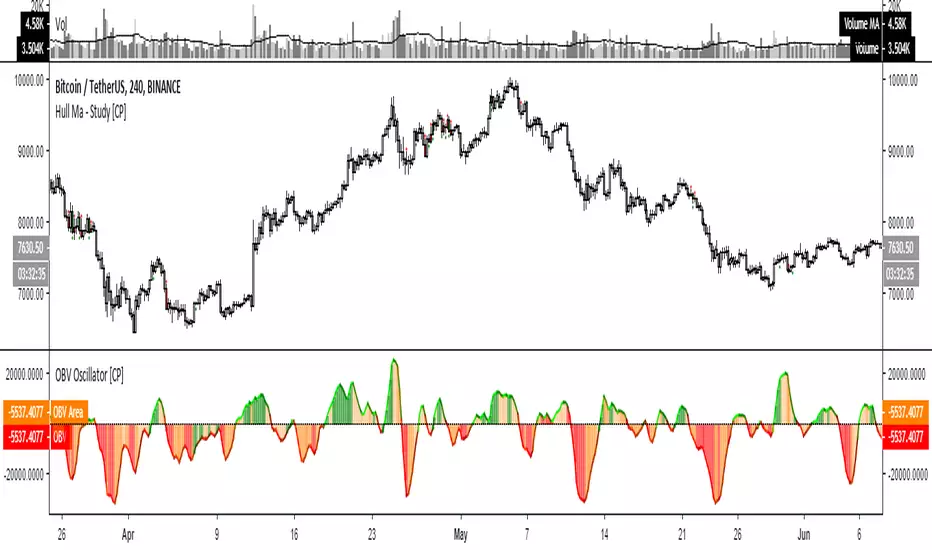
This is my version of the OBV Oscillator and I've used CCI to color the histogram
Line colors:
* Lime rising line above 0 line: Strong Bullish
* Green falling line above 0 line : Neutral Bullish
* Red falling line below 0 line : Strong Bearish
* Maroon rising line below 0 line : Neutral Bearish
Histogram colors:
*Green background above 0 line: Strong Bullish / Overbought
*Orange background above 0 line: Neutral Bullish
*Red background below 0 line: Strong Bearish / Oversold
*Orange background below 0 line: Neutral Bearish
Script protegido
Esse script é publicada como código fechado. No entanto, você pode gerenciar suas escolhas de bate-papo. Por favor, abra suas Configurações do perfil
Aviso legal
As informações e publicações não se destinam a ser, e não constituem, conselhos ou recomendações financeiras, de investimento, comerciais ou de outro tipo fornecidos ou endossados pela TradingView. Leia mais nos Termos de Uso.