OPEN-SOURCE SCRIPT
Candlestick Pattern Detector
Candlestick Pattern Detector
Overview
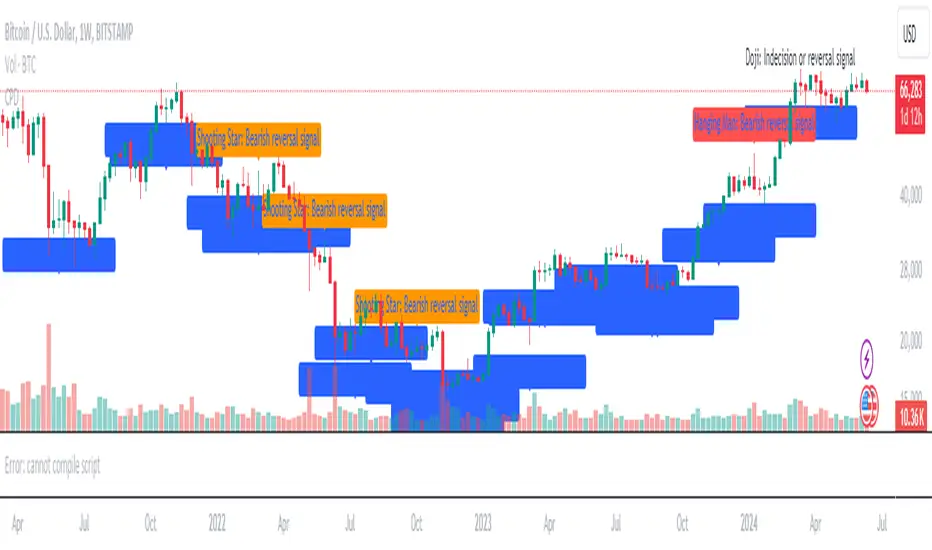
Welcome to the Candlestick Pattern Detector, a powerful tool designed to help traders identify key candlestick patterns on any chart. This indicator detects some of the most significant candlestick patterns and provides brief descriptions directly on the chart, making it easier for you to interpret market signals and make informed trading decisions.
Detected Patterns
Doji
Description: A Doji indicates market indecision. It occurs when the open and close prices are very close, suggesting a balance between bullish and bearish forces.
Signal: Possible trend reversal or continuation depending on the context.
Hammer
Description: A Hammer appears at the bottom of a downtrend, characterized by a small body and a long lower wick. It suggests that buyers are stepping in to push prices higher.
Signal: Bullish reversal.
Hanging Man
Description: The Hanging Man occurs at the top of an uptrend with a small body and a long lower wick. It indicates that selling pressure is starting to take over.
Signal: Bearish reversal.
Shooting Star
Description: The Shooting Star appears at the top of an uptrend with a small body and a long upper wick, indicating that buyers are losing control and sellers may push prices down.
Signal: Bearish reversal.
How to Use
Add to Chart: Click on the "Indicators" button in TradingView, search for "Candlestick Pattern Detector," and add it to your chart.
Visual Signals: The indicator will automatically mark detected patterns with labels on your chart.
Interpret Patterns: Use the brief descriptions provided with each detected pattern to understand market sentiment and potential price movements.
Conclusion
The Candlestick Pattern Detector is a helpful tool for traders of all levels, providing clear and concise information about key candlestick patterns. By integrating this indicator into your trading strategy, you can enhance your ability to read price action and make better trading decisions.
Overview
Welcome to the Candlestick Pattern Detector, a powerful tool designed to help traders identify key candlestick patterns on any chart. This indicator detects some of the most significant candlestick patterns and provides brief descriptions directly on the chart, making it easier for you to interpret market signals and make informed trading decisions.
Detected Patterns
Doji
Description: A Doji indicates market indecision. It occurs when the open and close prices are very close, suggesting a balance between bullish and bearish forces.
Signal: Possible trend reversal or continuation depending on the context.
Hammer
Description: A Hammer appears at the bottom of a downtrend, characterized by a small body and a long lower wick. It suggests that buyers are stepping in to push prices higher.
Signal: Bullish reversal.
Hanging Man
Description: The Hanging Man occurs at the top of an uptrend with a small body and a long lower wick. It indicates that selling pressure is starting to take over.
Signal: Bearish reversal.
Shooting Star
Description: The Shooting Star appears at the top of an uptrend with a small body and a long upper wick, indicating that buyers are losing control and sellers may push prices down.
Signal: Bearish reversal.
How to Use
Add to Chart: Click on the "Indicators" button in TradingView, search for "Candlestick Pattern Detector," and add it to your chart.
Visual Signals: The indicator will automatically mark detected patterns with labels on your chart.
Interpret Patterns: Use the brief descriptions provided with each detected pattern to understand market sentiment and potential price movements.
Conclusion
The Candlestick Pattern Detector is a helpful tool for traders of all levels, providing clear and concise information about key candlestick patterns. By integrating this indicator into your trading strategy, you can enhance your ability to read price action and make better trading decisions.
Script de código aberto
Em verdadeiro espírito do TradingView, o criador deste script o tornou de código aberto, para que os traders possam revisar e verificar sua funcionalidade. Parabéns ao autor! Embora você possa usá-lo gratuitamente, lembre-se de que a republicação do código está sujeita às nossas Regras da Casa.
Aviso legal
As informações e publicações não se destinam a ser, e não constituem, conselhos ou recomendações financeiras, de investimento, comerciais ou de outro tipo fornecidos ou endossados pela TradingView. Leia mais nos Termos de Uso.