OPEN-SOURCE SCRIPT
MTF EMA Trend
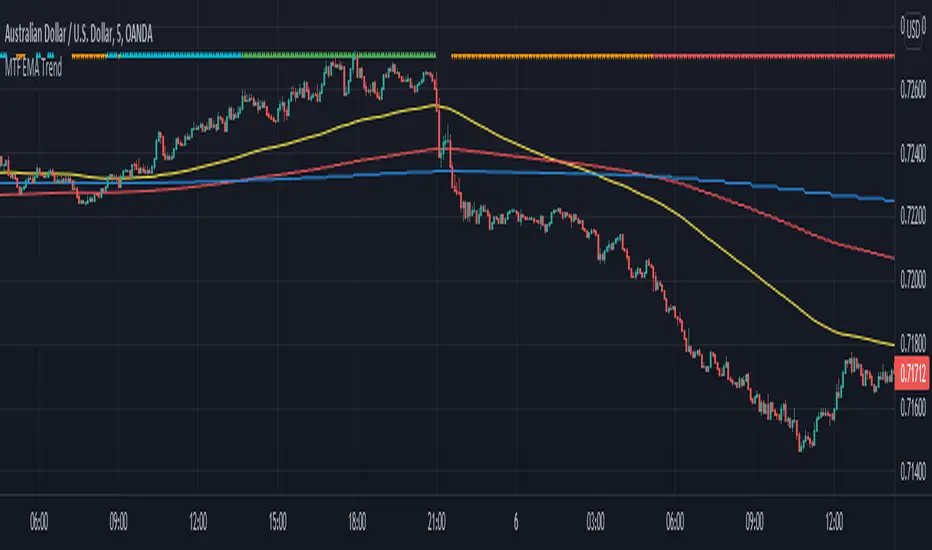
The indicator plots directional arrows on top of the chart to visualize the market's price trend. The plots are based on candle closing below all three multitimeframe EMAs, downtrend, when the EMAs are also in order (1 below 2 and 2 below 3). Opposite situation is uptrend.
It also marks a breakdown when the price closes under the third (supposedly always the slowest) EMA outside of aforementioned downtrend situation. Opposite is true for breakup to be marked.
Please always make sure, that the three EMAs are in order of EMA 1 being the fastest and 3rd the slowest. Default settings are used on the 5 minute timeframe.
Indicator can be used to quickly check the overall trend of the market as told by three MTF EMAs without needing to clutter the chart with the actual EMA plots. This is useful, for example, if you mainly base your scalping trades on other types of indicators, but you want a quick peek of the market direction or indecision.
Script de código aberto
Em verdadeiro espírito do TradingView, o criador deste script o tornou de código aberto, para que os traders possam revisar e verificar sua funcionalidade. Parabéns ao autor! Embora você possa usá-lo gratuitamente, lembre-se de que a republicação do código está sujeita às nossas Regras da Casa.
Aviso legal
As informações e publicações não se destinam a ser, e não constituem, conselhos ou recomendações financeiras, de investimento, comerciais ou de outro tipo fornecidos ou endossados pela TradingView. Leia mais nos Termos de Uso.