OPEN-SOURCE SCRIPT
Horizontal lines by Aydmaxx
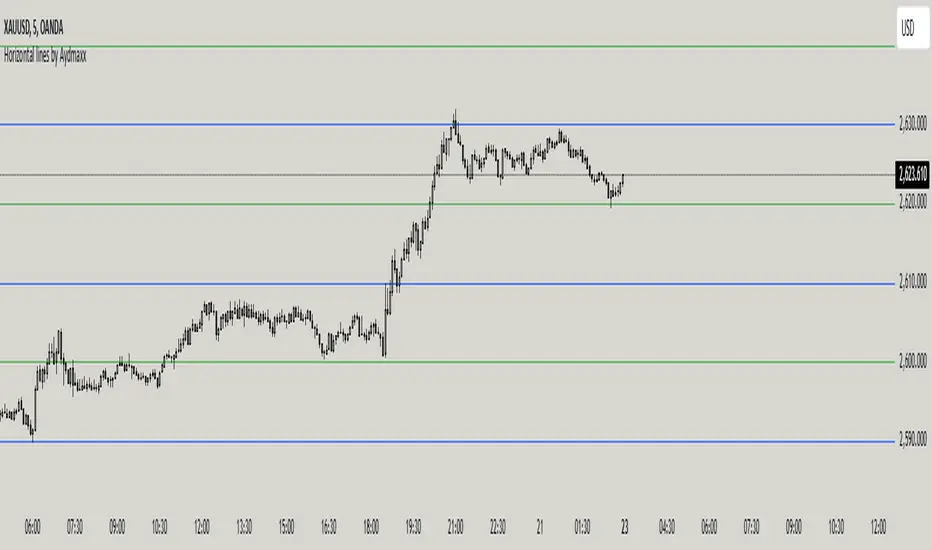
Indicator Description: Horizontal Lines by Aydmaxx
This indicator plots customizable horizontal lines on the chart to assist with technical analysis. It allows traders to define a starting price and a step size (gap) between the lines, making it versatile for a variety of strategies, such as identifying support, resistance, or key price levels.
How to Use:
Starting Price (Bottom): Enter the price level where the first (lowest) line should begin. This is your base level.
Example: If you're analyzing a market with prices around 2550, you can set this value to 2550 to align the indicator with your focus.
Gap (Step Size): Specify the interval or step size between consecutive lines.
Example: If you want lines every 10 points, set this value to 10.
Number of Lines: Adjust the total number of lines to display on the chart.
Line Style and Width: Customize the appearance of the lines (solid, dashed, dotted) and their thickness.
Line Colors and Transparency: Choose primary and secondary colors for alternating lines, and adjust the transparency to match your visual preferences.
This indicator is ideal for visualizing price zones and can be tailored to suit any trading style. Adjust the parameters based on your market analysis to highlight key price levels effectively.
Script de código aberto
Em verdadeiro espírito do TradingView, o criador deste script o tornou de código aberto, para que os traders possam revisar e verificar sua funcionalidade. Parabéns ao autor! Embora você possa usá-lo gratuitamente, lembre-se de que a republicação do código está sujeita às nossas Regras da Casa.
Aviso legal
As informações e publicações não se destinam a ser, e não constituem, conselhos ou recomendações financeiras, de investimento, comerciais ou de outro tipo fornecidos ou endossados pela TradingView. Leia mais nos Termos de Uso.