Volatility Index (Expo)
DESCRIPTION
Volatility can be referred to many things, but a commonly accepted definition of volatility is that it’s a measure of the risk or uncertainty in the market. Higher volatility is equal to more risk in the market. A simple way of describing it is that when volatility is high, the value of the market can be spread out over a larger range of values. This means that the price of the market can change dramatically over a short time period in either direction. A lower volatility means that a market's value does not fluctuate dramatically, and tends to be steadier. However, how to calculate and to apply volatility has been widely debated and many different calculations have been used. Volatility Index is a must for a professional trader in today's volatile markets.
This Volatility Index is derived from research within Volatility.
HOW TO USE
1. Use the indicator to detect low- respectively high volatility.
2. Enter the market when the volatility is low, and exit the market when the volatility is high.
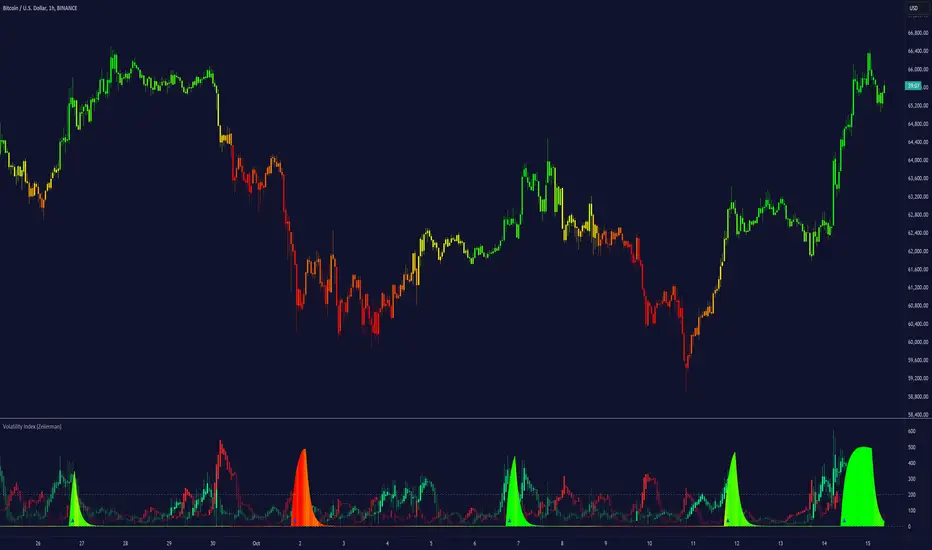
3. Use the indicator to identify when the volatility peaks. Can indicate that the market will shift or can be good areas to take profits.
Trend
When the market is in a positive trend, the volatility is low and stable. The opposite happens when the market is in a negative trend, the volatility is high and price moves boldly.
As a rule,when volatility increases unusually(abnormal) in relation to previous periods something is happening in the market, then wait until the volatility peaks or when the indicator does not make any new highs (the indicator becomes flat), and in conjunction with that the trending price action doesn’t make any new lows or respectively highs. When this happens there is a high probability that the market will take a temporary turn.
Positive volatility refers to when the volatility index increases with green candlesticks this means that the buyers are more aggressive than sellers. (Can indicate a trend change)
Negative volatility refers to when the volatility index increases with red candlesticks this means that the sellers are more aggressive than buyers. (Can indicate a trend change)
INDICATOR IN ACTION
This indicator is best presented live, the graphs below gives a hint of how the Volatility Index works.
The indicator works on any market, security, currency, stock, etc. and on any timeframe.
BTCUSD
EURUSD
WALL STREET
I hope you find this indicator useful, and please comment or contact me if you like the script or have any questions/suggestions for future improvements. Thanks!
I will continue to work on this indicator, so please share your experience and feedback with me so that I can continuously improve it. Thanks to everyone that have contacted me regarding my scripts. Your feedback is valuable for future developments!
ACCESS THE INDICATOR
• Contact me on TradingView or use the links below
-----------------
Disclaimer
Copyright by Zeiierman.
The information contained in my scripts/indicators/ideas does not constitute financial advice or a solicitation to buy or sell any securities of any type. I will not accept liability for any loss or damage, including without limitation any loss of profit, which may arise directly or indirectly from use of or reliance on such information.
All investments involve risk, and the past performance of a security, industry, sector, market, financial product, trading strategy, or individual’s trading does not guarantee future results or returns. Investors are fully responsible for any investment decisions they make. Such decisions should be based solely on an evaluation of their financial circumstances, investment objectives, risk tolerance, and liquidity needs.
My scripts/indicators/ideas are only for educational purposes!
- Impulse signals are added.
Best
- Improved calculations for better accuracy!
- Keep track of increased volatility with alerts!
A volatility spike can either be the end of a trend or the beginning of a new trend. That is why we always want to keep track of volatility spikes!
- Performance Improvements
- The old volatility calculation removed and replaced with a more accurate calculation
- The new volatility calculation can be used to catch the Bottom & Top
- Tooltip Added
- Alerts Added
- Multi-Timeframe function added
- Current Volatility Candles added
- Peak Volatility Trend coloring added
Script sob convite
Somente usuários aprovados pelo autor podem acessar este script. Você precisará solicitar e obter permissão para usá-lo. Normalmente, essa permissão é concedida após o pagamento. Para obter mais detalhes, siga as instruções do autor abaixo ou entre em contato diretamente com Zeiierman.
A TradingView NÃO recomenda pagar ou usar um script, a menos que você confie totalmente em seu autor e entenda como ele funciona. Você também pode encontrar alternativas gratuitas e de código aberto em nossos scripts da comunidade.
Instruções do autor
Join Our Free Discord: discord.gg/zeiiermantrading
Aviso legal
Script sob convite
Somente usuários aprovados pelo autor podem acessar este script. Você precisará solicitar e obter permissão para usá-lo. Normalmente, essa permissão é concedida após o pagamento. Para obter mais detalhes, siga as instruções do autor abaixo ou entre em contato diretamente com Zeiierman.
A TradingView NÃO recomenda pagar ou usar um script, a menos que você confie totalmente em seu autor e entenda como ele funciona. Você também pode encontrar alternativas gratuitas e de código aberto em nossos scripts da comunidade.
Instruções do autor
Join Our Free Discord: discord.gg/zeiiermantrading