PROTECTED SOURCE SCRIPT
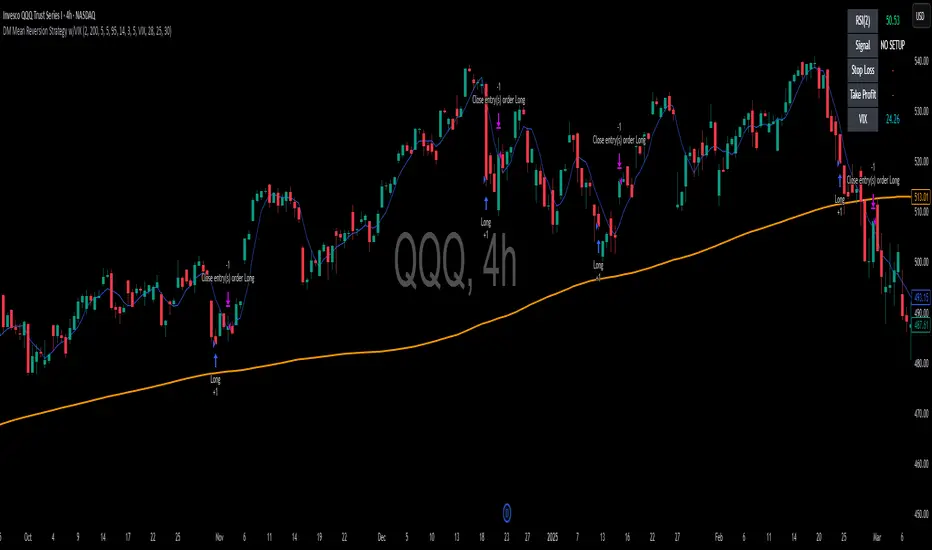
DM Mean Reversion Strategy w/VIX
This strategy works because it trades human emotion, not numbers.
Markets move the way they do because of:
Fear
Greed
Panic
FOMO
Regret
Relief
Your indicators are just tools to measure those emotions.
1. RSI(2) → Measures Emotional Overreaction
RSI(2) doesn’t measure “strength”.
It measures short-term emotional imbalance.
What it sees:
When RSI(2) < 5 → People are panicking
When RSI(2) > 95 → People are overconfident / greedy
Psychology behind it:
When RSI is very low:
People are thinking:
“I need to sell NOW before it crashes further!”
They’re not thinking logically.
They’re reacting emotionally.
That emotional selling is usually exaggerated, not rational.
You step in and take the other side of their fear.
2. 200 SMA → Measures Crowd Belief
The 200 SMA represents:
The long-term average opinion of the market.
Most institutions, hedge funds, and big traders use it.
Psychology behind it:
If price is above 200 SMA:
The crowd believes the asset is in a long-term uptrend.
More people are willing to buy dips.
If price is below it:
The crowd believes it’s in a long-term downtrend.
More people are looking to short rallies.
You’re aligning yourself with mass psychology, not fighting it.
3. 5 SMA → Measures Short-Term “Normal” Price
This is basically your:
“How far did price stretch away from normal?”
Psychology behind it:
People panic and overreact, sending price too far from its normal value.
Then once emotions cool down, price naturally comes back.
This is called:
Mean Reversion
When price crosses back over the 5 SMA, it means:
Panic is fading
Emotion is cooling
Price is returning to “fair value”
That’s why you exit there —
The emotional imbalance is over.
4. ATR → Measures Market Fear / Speed
ATR measures how wild price is moving.
High ATR = high fear, high uncertainty
Low ATR = calm market
Psychology behind it:
When the market is highly volatile:
People are emotional
Moves are erratic
False signals happen more
ATR helps adjust your stop loss so that:
You aren’t stopped out because of normal emotional noise.
It adapts your risk to how emotional the market currently is.
5. VIX → Measures Fear Level of the Entire Market
VIX is literally called the:
“Fear Index”
Psychology behind it:
When VIX is high:
People are scared
News is bad
Emotion dominates logic
Moves become irrational
When VIX is low:
Market is calm
People are thinking more rationally
Mean reversion works better
That’s why you block trades when VIX is too high.
You don’t want to trade in emotional chaos.
The Big Picture Psychology
Your strategy is based on one idea:
Humans overreact short-term
Then calm down
Then price normalizes
You are not predicting the future.
You are exploiting:
Emotional mistakes
Crowd overreaction
Human impatience
Fear and greed
While most traders react emotionally,
You are reacting statistically.
Real Mental Model for You
Think of it like this:
RSI(2) = Market panic meter
200 SMA = Crowd belief
5 SMA = Emotional balance point
ATR = Emotional intensity
VIX = Global fear gauge
You are basically:
Buying fear
Selling greed
In the direction of the crowd
When emotions are stretched.
______________________________________________________________
Here’s exactly when you place an entry with
DM Mean Reversion Strategy w/VIX – for both LONG and SHORT.
When to Enter a LONG (Buy / Calls)
You only place a LONG trade after a candle closes and all these are true:
Trend Filter (Bullish)
Price is above the 200 SMA
→ Market is in an uptrend.
RSI(2) Oversold
RSI(2) is below your buy level (default = 5)
→ Market is short-term oversold in an uptrend.
VIX Condition OK
VIX is below your block level (default 28)
VIX is below your long max (default 25)
VIX is falling or flat (today’s VIX ≤ yesterday’s)
→ Fear is not extreme and is calming down.
Candle is CLOSED
The bar has finished and the conditions above are true on the close,
not in the middle of the candle.
Entry timing:
You place the LONG trade at the open of the next candle after all the above were true at the close.
If you’re using the table:
It will typically show “LONG SETUP” when a valid long condition appears and you’re not in a trade yet.
____________________________________________________________
When to Enter a SHORT (Sell / Puts)
You only place a SHORT (or buy a Put) after a candle closes and all these are true:
Trend Filter (Bearish)
Price is below the 200 SMA
→ Market is in a downtrend.
RSI(2) Overbought
RSI(2) is above your sell level (default = 95)
→ Market is short-term overbought in a downtrend.
VIX Condition OK
VIX is below your block level (default 28)
VIX is below your short max (default 30)
VIX is rising or flat (today’s VIX ≥ yesterday’s)
→ Fear is starting to increase, which supports downside moves.
Candle is CLOSED
Wait for the bar to finish – don’t act mid-candle.
Entry timing:
You place the SHORT / PUT trade at the open of the next candle after those conditions were true at the close.
On the table:
You’ll see “SHORT SETUP” when a valid short opportunity is present and you’re flat.
When NOT to Enter
Do not enter if:
VIX is above the global block level (default 28)
→ Strategy is designed to avoid panic markets.
Candle hasn’t closed yet (mid-candle fluctuations don’t count).
Trend and RSI don’t line up (e.g., RSI oversold but price below 200 SMA → no long).
Script protegido
Esse script é publicada como código fechado. No entanto, você pode gerenciar suas escolhas de bate-papo. Por favor, abra suas Configurações do perfil
Aviso legal
As informações e publicações não se destinam a ser, e não constituem, conselhos ou recomendações financeiras, de investimento, comerciais ou de outro tipo fornecidos ou endossados pela TradingView. Leia mais nos Termos de Uso.