OPEN-SOURCE SCRIPT
TICK Price Label Colors[Salty]

The ticker symbol for the NYSE CUMULATIVE Tick Index is TICK. The Tick Index is a short-term indicator that shows the number of stocks trading up minus the number of stocks trading down. Traders can use this ratio to make quick trading decisions based on market movement. For example, a positive tick index can indicate market optimism, while readings of +1,000 and -1,000 can indicate overbought or oversold conditions.
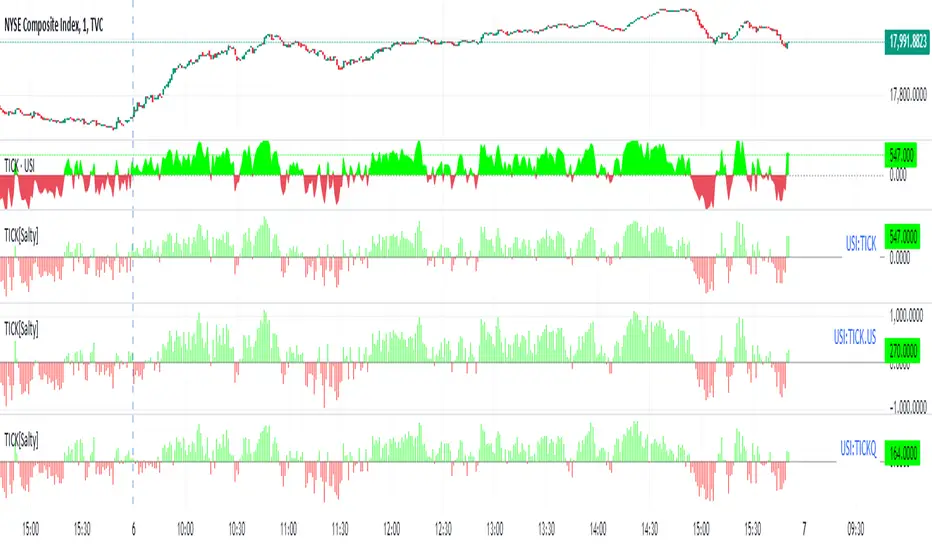
This script is used to color code the price label of the Symbol values zero or above in Green(default), and values below zero in red(default). For a dynamic symbol like the TICK this tells me the market is bullish when Green or Bearish when Red. I was previously using the baseline style with a Base level of 50 to accomplish this view of the symbol, but it was always difficult to maintain the zero level at the zero TICK value. This indicator is always able to color code the price label properly. Also, it has the benefit of setting the timeframe to 1 second(default) that is maintained even when the chart timeframe is changed.
Update: Added the ability to show the TICK Symbol to support viewing multiple TICK tickers at once as shown.
Script de código aberto
Em verdadeiro espírito do TradingView, o criador deste script o tornou de código aberto, para que os traders possam revisar e verificar sua funcionalidade. Parabéns ao autor! Embora você possa usá-lo gratuitamente, lembre-se de que a republicação do código está sujeita às nossas Regras da Casa.
Aviso legal
As informações e publicações não se destinam a ser, e não constituem, conselhos ou recomendações financeiras, de investimento, comerciais ou de outro tipo fornecidos ou endossados pela TradingView. Leia mais nos Termos de Uso.