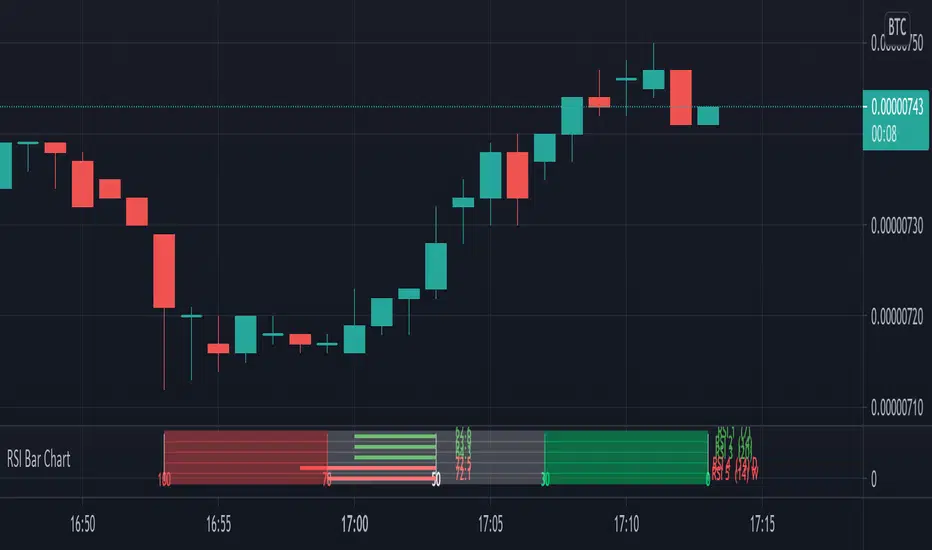
A different way to plot several RSI at once,
5 RSI with different options:
- source, length, timeframe
- size of indicator (width)
- color change
- limit change (30, 70), labels will be changed accordingly
- type of RSI line (line, arrow), linewidth
- offset label (at the right)
There are 4 colors (RSI line)
- when RSI > sell limit
- when RSI > 50 but below sell limit
- when RSI < 50 but above buy limit
- when RSI < buy limit


Arrows:

Different size:


Cheers!
5 RSI with different options:
- source, length, timeframe
- size of indicator (width)
- color change
- limit change (30, 70), labels will be changed accordingly
- type of RSI line (line, arrow), linewidth
- offset label (at the right)
There are 4 colors (RSI line)
- when RSI > sell limit
- when RSI > 50 but below sell limit
- when RSI < 50 but above buy limit
- when RSI < buy limit
Arrows:
Different size:
Cheers!
Notas de Lançamento
Now every number (label) is changed when the label size is adjustedAlso shortened the script by adding f_rsi()
Notas de Lançamento
Small bug fix -> labels at the right are now visible on symbols sessions that stop in the weekendNotas de Lançamento
Blurry text/lines fixNotas de Lançamento
UpdateScript de código aberto
Em verdadeiro espírito do TradingView, o criador deste script o tornou de código aberto, para que os traders possam revisar e verificar sua funcionalidade. Parabéns ao autor! Embora você possa usá-lo gratuitamente, lembre-se de que a republicação do código está sujeita às nossas Regras da Casa.
Who are PineCoders?
tradingview.com/chart/SSP/yW5eOqtm-Who-are-PineCoders/
TG Pine Script® Q&A: t.me/PineCodersQA
- We cannot control our emotions,
but we can control our keyboard -
tradingview.com/chart/SSP/yW5eOqtm-Who-are-PineCoders/
TG Pine Script® Q&A: t.me/PineCodersQA
- We cannot control our emotions,
but we can control our keyboard -
Aviso legal
As informações e publicações não se destinam a ser, e não constituem, conselhos ou recomendações financeiras, de investimento, comerciais ou de outro tipo fornecidos ou endossados pela TradingView. Leia mais nos Termos de Uso.
Script de código aberto
Em verdadeiro espírito do TradingView, o criador deste script o tornou de código aberto, para que os traders possam revisar e verificar sua funcionalidade. Parabéns ao autor! Embora você possa usá-lo gratuitamente, lembre-se de que a republicação do código está sujeita às nossas Regras da Casa.
Who are PineCoders?
tradingview.com/chart/SSP/yW5eOqtm-Who-are-PineCoders/
TG Pine Script® Q&A: t.me/PineCodersQA
- We cannot control our emotions,
but we can control our keyboard -
tradingview.com/chart/SSP/yW5eOqtm-Who-are-PineCoders/
TG Pine Script® Q&A: t.me/PineCodersQA
- We cannot control our emotions,
but we can control our keyboard -
Aviso legal
As informações e publicações não se destinam a ser, e não constituem, conselhos ou recomendações financeiras, de investimento, comerciais ou de outro tipo fornecidos ou endossados pela TradingView. Leia mais nos Termos de Uso.