PROTECTED SOURCE SCRIPT
Atualizado Squeeze Zone
This script supports my previous post Empirical Suite
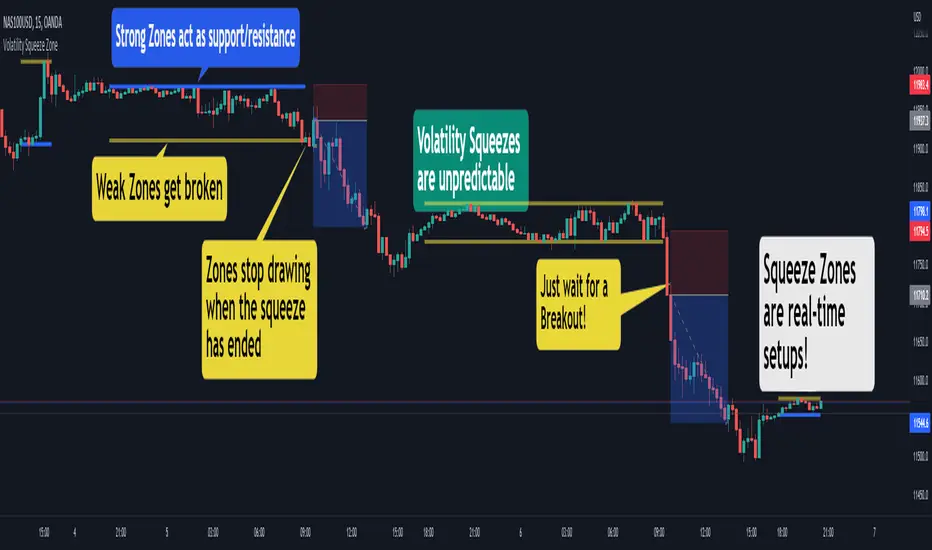
It automatically plots Support and Resistance levels on the chart during periods of volatility squeeze.
You have three plotting methods:
The levels are color-coded:
*Red: weak, one-sided volatility squeeze
*Orange: typically strong, no volatility issue
You can have a double-red zone, where both buying and selling volatility has dropped.
Combine this with the Empirical Suite or your favorite
analysis tools for extra confirmation.
Cheers,
EFX
It automatically plots Support and Resistance levels on the chart during periods of volatility squeeze.
You have three plotting methods:
- From High to Low
- From Open to Close
- Linear Regression (experimental)
The levels are color-coded:
*Red: weak, one-sided volatility squeeze
*Orange: typically strong, no volatility issue
You can have a double-red zone, where both buying and selling volatility has dropped.
Combine this with the Empirical Suite or your favorite
analysis tools for extra confirmation.
Cheers,
EFX
Notas de Lançamento
Updated defaultsRemoved poorly performing settings
Notas de Lançamento
- Upgrade to Pine V5
- Choose your own colors for Zones!
- Improved default settings
Script protegido
Esse script é publicada como código fechado. No entanto, você pode gerenciar suas escolhas de bate-papo. Por favor, abra suas Configurações do perfil
Algo Trading Simplified 👉 PaxProfits.com
Discover the easy way to manage Forex trading accounts. Trusted by traders globally.
Discover the easy way to manage Forex trading accounts. Trusted by traders globally.
Aviso legal
As informações e publicações não se destinam a ser, e não constituem, conselhos ou recomendações financeiras, de investimento, comerciais ou de outro tipo fornecidos ou endossados pela TradingView. Leia mais nos Termos de Uso.