OPEN-SOURCE SCRIPT
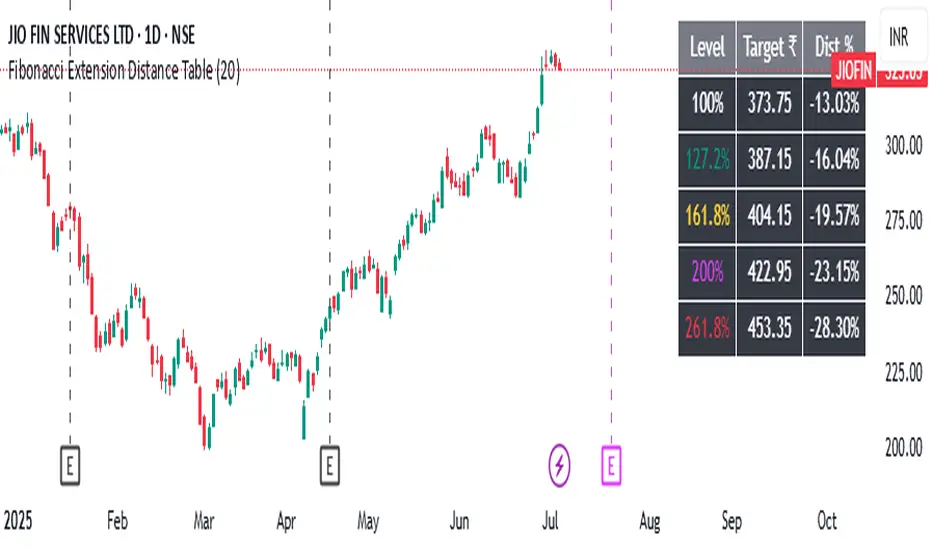
Fibonacci Extension Distance Table

## 🧾 **Script Name**: Fibonacci Extension Distance Table
### 🎯 Purpose:
This script helps traders visually track **key Fibonacci extension levels** on any chart and immediately see:
* The **price target** at each extension
* The **distance in percentage** from the current market price
It is especially helpful for:
* **Profit targets in trending trades**
* Monitoring **potential resistance zones** in uptrends
* Planning **entry/exit timing**
---
## 🧮 **How It Works**
1. **Swing Logic (A → B → C)**
* It automatically finds:
* `A`: the **lowest low** in the last `swingLen` bars
* `B`: the **highest high** in that same lookback
* `C`: current bar’s low is used as the **retracement point** (simplified)
2. **Extension Formula**
Using the Fibonacci formula:
```text
Extension Price = C + (B - A) × Fibonacci Ratio
```
The script calculates projected target prices at:
* **100%**
* **127.2%**
* **161.8%** (Golden Ratio)
* **200%**
* **261.8%**
3. **Distance Calculation**
For each level, it calculates:
* The **absolute difference** between current price and the extension level
* The **percentage difference**, which helps quickly assess how close or far the market is from that target
---
## 📋 **Table Output in Top Right**
| Level | Target ₹ | Dist % from current price |
| ------ | ---------- | ------------------------- |
| 100% | Calculated | % Above/Below |
| 127.2% | Calculated | % Above/Below |
| 161.8% | Calculated | % Above/Below |
| 200% | Calculated | % Above/Below |
| 261.8% | Calculated | % Above/Below |
* The table updates **live on each bar**
* It **highlights levels** where price is nearing
* Useful in **any time frame** and **any market** (stocks, crypto, forex)
---
## 🔔 Example Use Case
You bought a stock at ₹100, and recent swing shows:
* A = ₹80
* B = ₹110
* C = ₹100
The 161.8% extension = 100 + (110 − 80) × 1.618 = ₹148.54
If the current price is ₹144, the table will show:
* Golden Ratio Target: ₹148.54
* Distance: −4.54
* Distance %: −3.05%
You now know your **target is near** and can plan your **exit or trailing stop**.
---
## 🧠 Benefits
* No need to draw extensions manually
* Automatically adapts to new swing structures
* Supports **scalping**, **swing**, and **positional** strategies
Script de código aberto
Em verdadeiro espírito do TradingView, o criador deste script o tornou de código aberto, para que os traders possam revisar e verificar sua funcionalidade. Parabéns ao autor! Embora você possa usá-lo gratuitamente, lembre-se de que a republicação do código está sujeita às nossas Regras da Casa.
Aviso legal
As informações e publicações não se destinam a ser, e não constituem, conselhos ou recomendações financeiras, de investimento, comerciais ou de outro tipo fornecidos ou endossados pela TradingView. Leia mais nos Termos de Uso.