OPEN-SOURCE SCRIPT
Triple HMA Bands (1.2 / 1.4 / 1.6)
📈 Triple HMA Bands — Custom Volatility & Trend Indicator
Description:
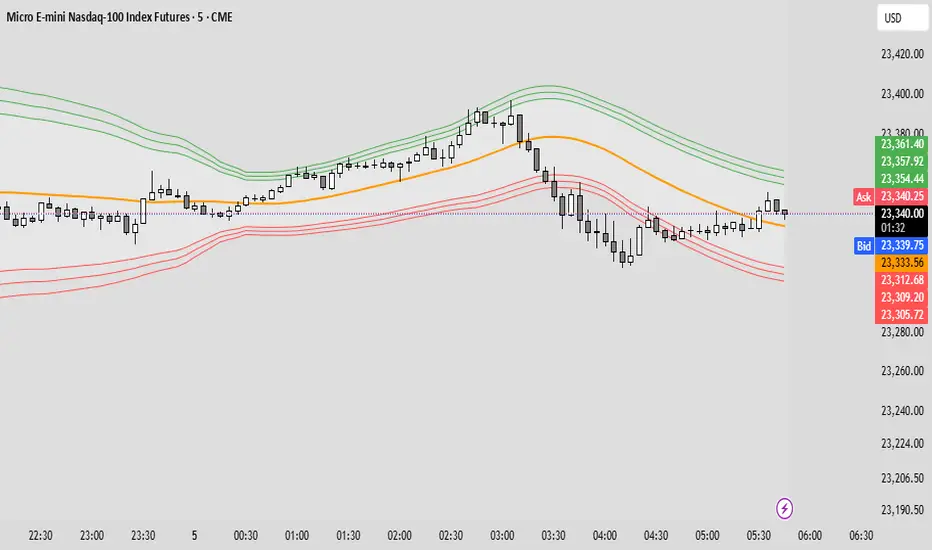
The Triple HMA Bands indicator combines the Hull Moving Average (HMA) with volatility-based envelopes, similar to Bollinger Bands, to visualize trend direction and market extremes.
The HMA (length 90) serves as the central trend line, offering a smooth and responsive view of market direction.
Surrounding the HMA are three dynamic bands calculated using standard deviations of price:
Inner Band (1.2σ) — normal volatility range.
Middle Band (1.4σ) — elevated volatility zone.
Outer Band (1.6σ) — statistically extreme price movement.
The shaded zones between the bands help visualize volatility expansion and contraction, making it easier to identify:
Trend strength and stability
Potential reversal zones
Breakout or breakdown events
How to Use:
Price staying within the inner band may indicate a stable trend or consolidation.
Price reaching or exceeding the outer band suggests overbought/oversold conditions and potential reversal.
Widening bands = rising volatility; narrowing bands = low volatility, often before a breakout.
This indicator is ideal for trend traders, mean reversion strategies, or anyone wanting a volatility-sensitive trend filter.
Description:
The Triple HMA Bands indicator combines the Hull Moving Average (HMA) with volatility-based envelopes, similar to Bollinger Bands, to visualize trend direction and market extremes.
The HMA (length 90) serves as the central trend line, offering a smooth and responsive view of market direction.
Surrounding the HMA are three dynamic bands calculated using standard deviations of price:
Inner Band (1.2σ) — normal volatility range.
Middle Band (1.4σ) — elevated volatility zone.
Outer Band (1.6σ) — statistically extreme price movement.
The shaded zones between the bands help visualize volatility expansion and contraction, making it easier to identify:
Trend strength and stability
Potential reversal zones
Breakout or breakdown events
How to Use:
Price staying within the inner band may indicate a stable trend or consolidation.
Price reaching or exceeding the outer band suggests overbought/oversold conditions and potential reversal.
Widening bands = rising volatility; narrowing bands = low volatility, often before a breakout.
This indicator is ideal for trend traders, mean reversion strategies, or anyone wanting a volatility-sensitive trend filter.
Script de código aberto
Em verdadeiro espírito do TradingView, o criador deste script o tornou de código aberto, para que os traders possam revisar e verificar sua funcionalidade. Parabéns ao autor! Embora você possa usá-lo gratuitamente, lembre-se de que a republicação do código está sujeita às nossas Regras da Casa.
Aviso legal
As informações e publicações não se destinam a ser, e não constituem, conselhos ou recomendações financeiras, de investimento, comerciais ou de outro tipo fornecidos ou endossados pela TradingView. Leia mais nos Termos de Uso.