OPEN-SOURCE SCRIPT
Volume Weighted Standard Deviation (VWSD)
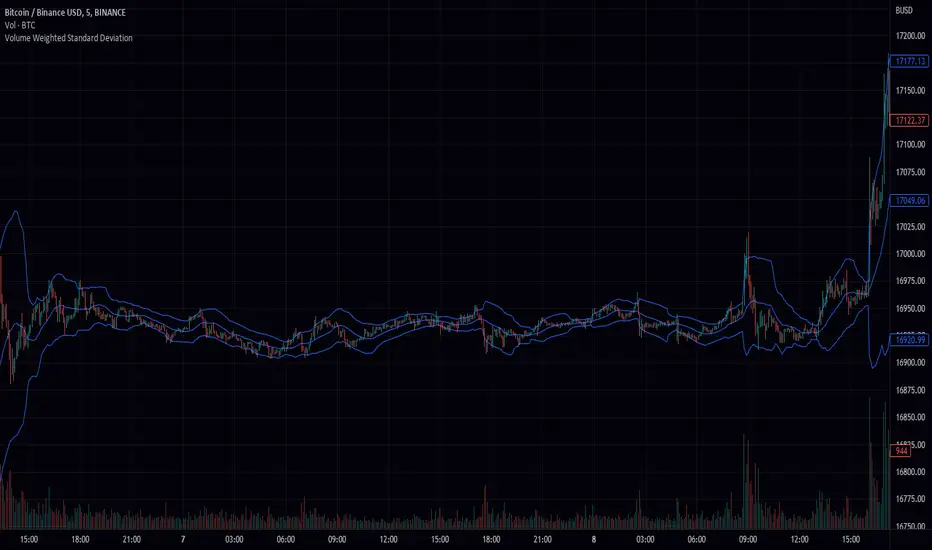
The Volume Weighted Standard Deviation indicator is a custom technical analysis tool that uses the volume of trading to calculate the standard deviation of a stock's price. This indicator takes the source of data, the length of data, and the deviation as inputs, and calculates the volume weighted standard deviation using the values.
The indicator first calculates the mean price and mean volume by using simple moving average over the given length of data. Then it calculates the squared difference between the mean price and the actual price, multiplied by the volume. This gives a volume-weighted squared difference. The indicator then calculates the square root of the sum of the volume-weighted squared differences divided by the sum of the volumes over the given length of data. This gives the volume weighted standard deviation.
The indicator then plots the standard deviation and deviation as a band around the simple moving average of the source data, providing a clear view of the volatility of the stock.
In summary, the Volume Weighted Standard Deviation indicator is a powerful tool for measuring the volatility of a stock by taking into account the volume of trading. It uses the volume of trading to calculate the standard deviation of a stock's price, giving a more accurate representation of the volatility of the stock. It can be useful for traders to identify entry and exit points and make more informed trading decisions.
Script de código aberto
Em verdadeiro espírito do TradingView, o criador deste script o tornou de código aberto, para que os traders possam revisar e verificar sua funcionalidade. Parabéns ao autor! Embora você possa usá-lo gratuitamente, lembre-se de que a republicação do código está sujeita às nossas Regras da Casa.
Aviso legal
As informações e publicações não se destinam a ser, e não constituem, conselhos ou recomendações financeiras, de investimento, comerciais ou de outro tipo fornecidos ou endossados pela TradingView. Leia mais nos Termos de Uso.