OPEN-SOURCE SCRIPT
Atualizado Ultra Volume Detector
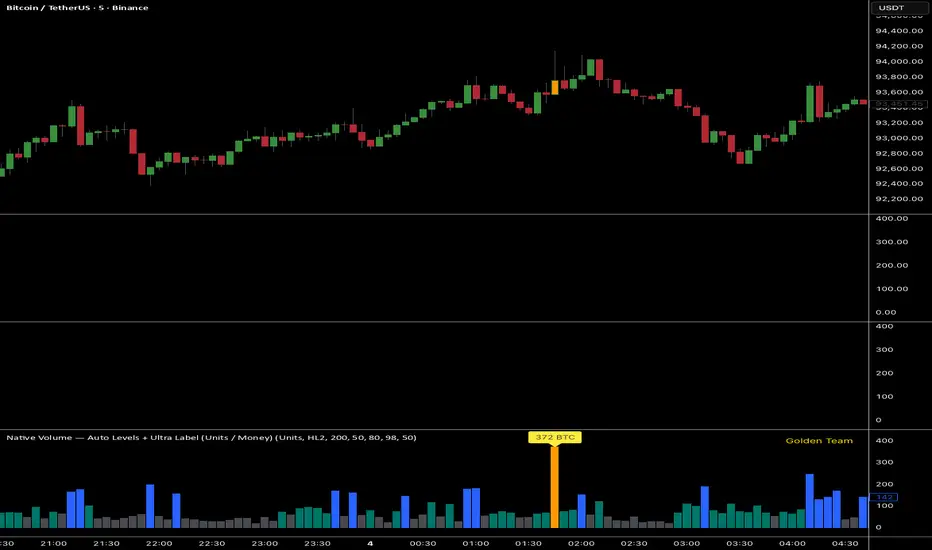
Native Volume — Auto Levels + Ultra Label
What it does
This indicator classifies volume bars into four categories — Low, Medium, High, and Ultra — using rolling percentile thresholds. Instead of fixed cutoffs, it adapts dynamically to recent market activity, making it useful across different symbols and timeframes. Ultra-high volume bars are highlighted with labels showing compacted values (K/M/B/T) and the appropriate unit (shares, contracts, ticks, etc.).
Core Logic
Dynamic thresholds: Calculates percentile levels (e.g., 50th, 80th, 98th) over a user-defined window of bars.
Categorization: Bars are colored by category (Low/Med/High/Ultra).
Ultra labeling: Only Ultra bars are labeled, preventing chart clutter.
Optional MA: A moving average of raw volume can be plotted for context.
Alerts: Supports both alert condition for Ultra events and dynamic alert() messages that include the actual volume value at bar close.
How to use
Adjust window size: Larger windows (e.g., 200+) provide stable thresholds; smaller windows react more quickly.
Set percentiles: Typical defaults are 50 for Medium, 80 for High, and 98 for Ultra. Lower the Ultra percentile to see more frequent signals, or raise it to isolate only extreme events.
Read chart signals:
Bar colors show the category.
Labels appear only on Ultra bars.
Alerts can be set up for automatic notification when Ultra volume occurs.
Why it’s unique
Adaptive: Uses rolling statistics, not static thresholds.
Cross-asset ready: Adjusts units automatically depending on instrument type.
Efficient visualization: Focuses labels only on the most significant events, reducing noise.
⚠️ Disclaimer: This tool is for educational and analytical purposes only. It does not provide financial advice. Always test and manage risk before trading live
Notas de Lançamento
add money volumeNotas de Lançamento
add candle colorScript de código aberto
Em verdadeiro espírito do TradingView, o criador deste script o tornou de código aberto, para que os traders possam revisar e verificar sua funcionalidade. Parabéns ao autor! Embora você possa usá-lo gratuitamente, lembre-se de que a republicação do código está sujeita às nossas Regras da Casa.
Aviso legal
As informações e publicações não se destinam a ser, e não constituem, conselhos ou recomendações financeiras, de investimento, comerciais ou de outro tipo fornecidos ou endossados pela TradingView. Leia mais nos Termos de Uso.
Script de código aberto
Em verdadeiro espírito do TradingView, o criador deste script o tornou de código aberto, para que os traders possam revisar e verificar sua funcionalidade. Parabéns ao autor! Embora você possa usá-lo gratuitamente, lembre-se de que a republicação do código está sujeita às nossas Regras da Casa.
Aviso legal
As informações e publicações não se destinam a ser, e não constituem, conselhos ou recomendações financeiras, de investimento, comerciais ou de outro tipo fornecidos ou endossados pela TradingView. Leia mais nos Termos de Uso.