OPEN-SOURCE SCRIPT
Atualizado Key Levels
Key Levels Indicator
In the world of trading, manually identifying and plotting key levels for every close can be a tedious and error-prone task. This indicator stands out by automatically detecting and plotting only those levels where a significant shift in market sentiment has occurred. Unlike traditional indicators that plot lines for every open or close, this tool focuses on levels where liquidity has changed hands, indicating a potential shift in momentum.
How It Works:
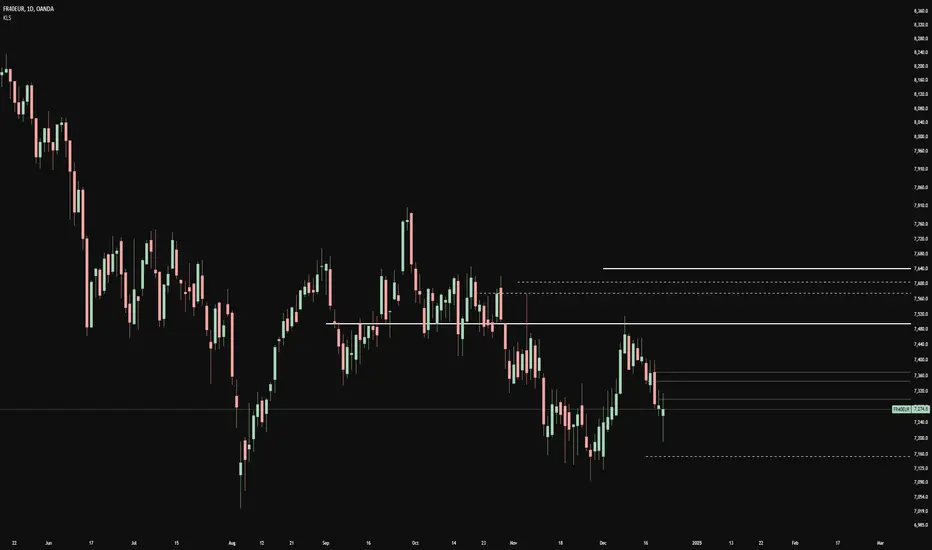
- The indicator identifies Higher Timeframe (HTF) reversals, plotting levels only when a bearish candle is followed by a bullish one, or vice versa.
- Weekly levels are represented by dashed lines, while monthly levels are solid, providing clear visual differentiation.
- Levels are drawn at the open price of the reversal candle, starting precisely at the beginning of the new HTF bar.
Why It's Different:
- Focuses on genuine shifts in market sentiment rather than arbitrary price points.
- Automatically manages the number of visible levels to prevent chart clutter.
- Ideal for range traders and mean reversion strategies, offering insights into potential support and resistance zones where market participants have shown a change in behavior.
Usage Note:
While this indicator provides valuable insights, it should not be used in isolation. Always consider the broader market context and combine it with other analysis techniques for optimal results.
Settings:
- Toggle weekly/monthly levels
- Adjust the number of visible levels (1-20)
- Customize level colors
In the world of trading, manually identifying and plotting key levels for every close can be a tedious and error-prone task. This indicator stands out by automatically detecting and plotting only those levels where a significant shift in market sentiment has occurred. Unlike traditional indicators that plot lines for every open or close, this tool focuses on levels where liquidity has changed hands, indicating a potential shift in momentum.
How It Works:
- The indicator identifies Higher Timeframe (HTF) reversals, plotting levels only when a bearish candle is followed by a bullish one, or vice versa.
- Weekly levels are represented by dashed lines, while monthly levels are solid, providing clear visual differentiation.
- Levels are drawn at the open price of the reversal candle, starting precisely at the beginning of the new HTF bar.
Why It's Different:
- Focuses on genuine shifts in market sentiment rather than arbitrary price points.
- Automatically manages the number of visible levels to prevent chart clutter.
- Ideal for range traders and mean reversion strategies, offering insights into potential support and resistance zones where market participants have shown a change in behavior.
Usage Note:
While this indicator provides valuable insights, it should not be used in isolation. Always consider the broader market context and combine it with other analysis techniques for optimal results.
Settings:
- Toggle weekly/monthly levels
- Adjust the number of visible levels (1-20)
- Customize level colors
Notas de Lançamento
Key Levels IndicatorIn the world of trading, manually identifying and plotting key levels for every close can be a tedious and error-prone task. This indicator stands out by automatically detecting and plotting only those levels where a significant shift in market sentiment has occurred. Unlike traditional indicators that plot lines for every open or close, this tool focuses on levels where liquidity has changed hands, indicating a potential shift in momentum.
How It Works:
- The indicator identifies Higher Timeframe (HTF) reversals, plotting levels only when a bearish candle is followed by a bullish one, or vice versa.
- Weekly levels are represented by dashed lines, while monthly levels are solid, providing clear visual differentiation.
- Levels are drawn at the open price of the reversal candle, starting precisely at the beginning of the new HTF bar.
Why It's Different:
- Focuses on genuine shifts in market sentiment rather than arbitrary price points.
- Automatically manages the number of visible levels to prevent chart clutter.
- Ideal for range traders and mean reversion strategies, offering insights into potential support and resistance zones where market participants have shown a change in behavior.
Usage Note:
While this indicator provides valuable insights, it should not be used in isolation. Always consider the broader market context and combine it with other analysis techniques for optimal results.
Settings:
- Toggle weekly/monthly levels
- Adjust the number of visible levels (1-20)
- Customize level colors
- Added Custom Timeframes
Notas de Lançamento
Added Custom Timeframe LevelsScript de código aberto
Em verdadeiro espírito do TradingView, o criador deste script o tornou de código aberto, para que os traders possam revisar e verificar sua funcionalidade. Parabéns ao autor! Embora você possa usá-lo gratuitamente, lembre-se de que a republicação do código está sujeita às nossas Regras da Casa.
Aviso legal
As informações e publicações não se destinam a ser, e não constituem, conselhos ou recomendações financeiras, de investimento, comerciais ou de outro tipo fornecidos ou endossados pela TradingView. Leia mais nos Termos de Uso.
Script de código aberto
Em verdadeiro espírito do TradingView, o criador deste script o tornou de código aberto, para que os traders possam revisar e verificar sua funcionalidade. Parabéns ao autor! Embora você possa usá-lo gratuitamente, lembre-se de que a republicação do código está sujeita às nossas Regras da Casa.
Aviso legal
As informações e publicações não se destinam a ser, e não constituem, conselhos ou recomendações financeiras, de investimento, comerciais ou de outro tipo fornecidos ou endossados pela TradingView. Leia mais nos Termos de Uso.