OPEN-SOURCE SCRIPT
Atualizado Price Change History
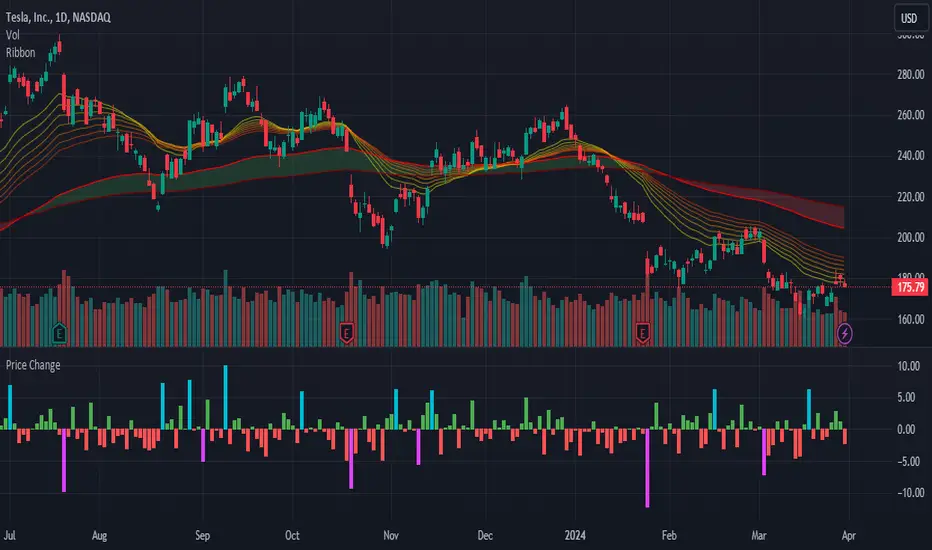
Display a histogram of price changes over a given interval. Show change as a percentage or in dollar amount. Highlight changes that exceed a particular value.
Notas de Lançamento
By default, the histogram shows price change since the previous bar. This update allows you to display price change since any number of bars ago.Notas de Lançamento
Separate high and low highlighting.Notas de Lançamento
Update study shorttitle.Notas de Lançamento
The ratio of highlighted to unhighlighted bars is now shown as the orange number ranging from 0 to 1.It takes into consideration the previous 50 bars by default, but can be changed by the user under settings.
Notas de Lançamento
- Updated the names of a few settings to be clearer as to what they do.- Included some documentation in the source code to explain each setting.
Notas de Lançamento
- Add default precision
- Improve comments
Notas de Lançamento
Updated to Pine Script v4Notas de Lançamento
- Update to Pine Script v5- Additional comments
- Code cleanup
Script de código aberto
Em verdadeiro espírito do TradingView, o criador deste script o tornou de código aberto, para que os traders possam revisar e verificar sua funcionalidade. Parabéns ao autor! Embora você possa usá-lo gratuitamente, lembre-se de que a republicação do código está sujeita às nossas Regras da Casa.
Aviso legal
As informações e publicações não se destinam a ser, e não constituem, conselhos ou recomendações financeiras, de investimento, comerciais ou de outro tipo fornecidos ou endossados pela TradingView. Leia mais nos Termos de Uso.