PROTECTED SOURCE SCRIPT
Sortino Ratio Tracker -> PROFABIGHI_CAPITAL
🌟 Overview
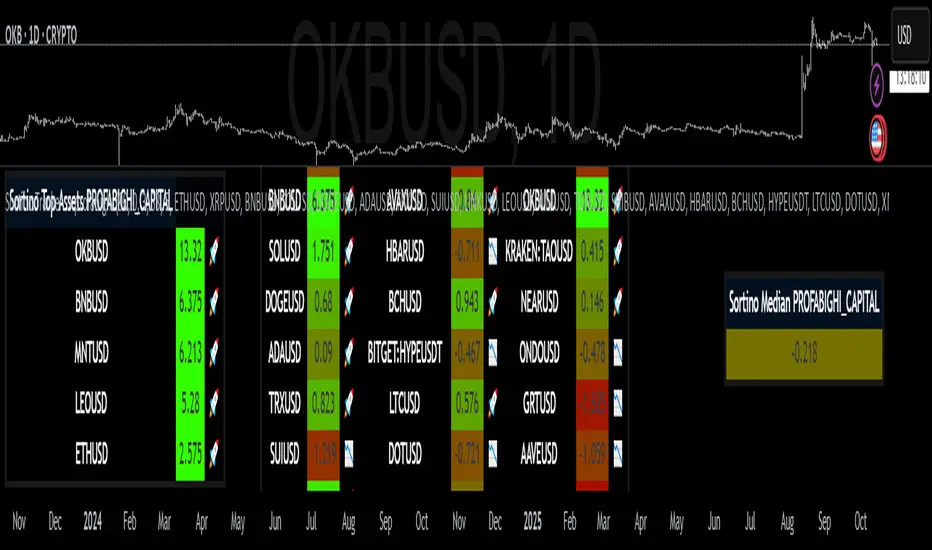
The Sortino Ratio Tracker → PROFABIGHI_CAPITAL indicator assesses downside risk-adjusted performance by computing the Sortino ratio for up to 33 customizable altcoins over a rolling lookback period, focusing solely on negative volatility to penalize harmful deviations while smoothing and annualizing for actionable insights. It dynamically generates color-gradient tables displaying individual Sortinos, median benchmarks, and ranked top performers with emoji indicators, empowering traders to prioritize assets with superior returns relative to their drawdown risks for more resilient portfolio construction.
⚙️ General Settings
– Calculation Period (Days/Bars): Specifies the historical window for return averaging and downside deviation estimation, where shorter periods emphasize recent efficiency amid volatility spikes while longer horizons evaluate enduring downside protection—vital for aligning with strategies like short-term trading (e.g., 30-60 bars) versus long-term holding (e.g., 90+ bars).
– Annual Risk-Free Rate (%): Sets the threshold below which returns are considered "downside," typically a conservative benchmark like treasury yields—higher rates raise the bar for positive Sortinos, favoring only truly superior risk-adjusted outcomes.
– Smoothing Period (EMA): Applies exponential moving average to raw ratios for noise reduction, where minimal smoothing (e.g., 1-3) preserves granularity for active monitoring while higher values (e.g., 5+) yield trend-stable views for strategic overviews.
– Number of Altcoins to Display: Determines the primary table's breadth from a streamlined 5-asset focus for rapid scans to a thorough 33-symbol panorama for exhaustive downside risk profiling—directly affects data processing and visual footprint.
– Number of Top Sortino Assets: Configures the leaderboard to spotlight leading ratios, scalable from 1 for laser-focused highlights to the full asset set for complete efficiency hierarchy—facilitates prioritization of low-downside winners.
💎 Asset Selection Settings
– Asset 1-17 (Left Group): Fills the main table's left column with cornerstone altcoins, enabling tailored selection from majors like ETHUSD to diversified options such as XRPUSD—each pulls daily closes for standalone Sortino computation, with tooltips verifying symbol conventions.
– Asset 18-33 (Right Group): Loads the right column for extended diversification, incorporating further tokens from LTCUSD to specialized choices like MNTUSD—promotes balanced tri-column ergonomics for fluid cross-dataset comparison.
– Dynamic Input Activation: Renders fields conditionally on total assets, hiding extras to avert errors and declutter the interface—supports frictionless growth from compact portfolios to all-encompassing surveillance.
🎨 Table Style Settings
– Low Sortino Color: Establishes the gradient's downside anchor (e.g., intense red for negative ratios), immediately flagging assets with excessive harmful volatility that could undermine portfolio stability.
– High Sortino Color: Pins the excellence terminus (e.g., luminous green for positive ratios), illuminating low-risk/high-return standouts perfect for conservative growth strategies.
– Neutral Sortino Value: Positions the color inflection at breakeven efficiency (typically 0.0), pivoting hues from penalty to premium—tweaking recalibrates toward defensive or opportunistic lenses.
– Sortino Color Range: Modulates the spectrum's transitional span around neutral, opting for broad fades in subtle differentiation or tight contrasts for stark performer/laggard splits.
– Table Background: Instills a understated dark semi-transparent foundation for unified readability across themes, evoking a sleek, professional analytics dashboard.
– Table Border: Circumscribes frames with unobtrusive gray for gentle containment, directing focus to the gradient-infused data without stylistic interference.
📡 Data Fetching
– Asset Data Retrieval: Performs concurrent daily close queries for specified symbols, substituting NA for voids to sustain table robustness.
– Return Series Computation: Extracts 1-period percentage changes from asset series, supplying the granular inputs for mean and downside deviation metrics.
– Missing Data Resilience: Employs sentinels (-9999) for gaps, manifesting as grays in tables to denote incompleteness without layout disruption.
🧮 Calculations
– Periodic Return Generation: Derives daily/bar percentage changes as source over prior close minus one, capturing discrete movements for efficiency evaluation.
– Mean Return Estimation: Averages returns over the rolling period with simple moving average, forging a baseline excess performance metric.
– Downside Deviation Quantification: Sums squared deviations below the risk-free threshold, averaging to measure only harmful volatility—ignores upside for focused risk penalization.
– Raw Sortino Formulation: Divides mean excess return by downside deviation, defaulting to zero on nil volatility for computational safety.
– EMA Noise Attenuation: Exponentially smooths raw ratios to filter transients, yielding interpretable trends over erratic daily swings.
– Annualization Adjustment: Scales smoothed ratios by the square root of 365 (crypto calendar), transforming periodic efficiency into yearly benchmarks for cross-asset comparability.
📋 Table Display
– Dynamic Layout Scaling: Erects columns (maximum 9 for tri-set grouping) and rows attuned to asset quantity plus header, guaranteeing compact utility for 1-33 symbols.
– Main Table Architecture: Branded header traverses the summit row, pursued by asset symbols, rounded ratios (3 decimals), and efficiency emojis in efficient trios for streamlined row navigation.
– Sortino Color Continuum: Maps values from low (red) via neutral (midpoint) to high (green), with grays for voids—enables instantaneous downside efficiency profiling.
– Emoji Efficiency Markers: Deploys rocket for above-median ratios (superior performers) and downward arrow for below (inferior), infusing swift visual assessment.
– Median Table Encapsulation: Succinct single-column portrayal of central ratio with gradient hue, anchoring relative evaluations as a risk-neutral pivot.
– Top Sortino Table Hierarchy: Descending classification in 3-column matrix (symbol, value, emoji) with header branding, concentrating on elite assets for downside-focused decisions.
– Index-Fueled Ranking: Exploits array indices for descending extraction, reconstructing sorted arrays while preserving originals for exact median derivation.
🔔 Alerts
– Dynamic Alert Fabrication: Constructs newline-separated assemblages of symbols and rounded ratios on the terminal bar, excising prefixes for terse formatting.
– Once-Per-Bar Dispatch: Initiates alerts at close with the complete dataset, accommodating external integrations like notifications or automated systems.
– Output Refinement: Curates parseable content by excluding NAs, zeroing in on executable data for streamlined workflow incorporation.
✅ Key Takeaways
– Downside-focused Sortino ratios spotlight assets excelling in returns per harmful volatility unit.
– Rolling computations with smoothing and annualization yield comparable, trend-stable efficiency metrics.
– Vast symbol adaptability crafts bespoke crypto dashboards from majors to alts.
– Gradient tables with medians and tops accelerate low-risk winner identification via visuals.
– Automated alerts consolidate scans into digestible packets, expediting from evaluation to execution.
Script protegido
Esse script é publicada como código fechado. No entanto, você pode usar ele livremente e sem nenhuma limitação – saiba mais aqui.
Aviso legal
As informações e publicações não devem ser e não constituem conselhos ou recomendações financeiras, de investimento, de negociação ou de qualquer outro tipo, fornecidas ou endossadas pela TradingView. Leia mais em Termos de uso.