OPEN-SOURCE SCRIPT
Candle Range Theory
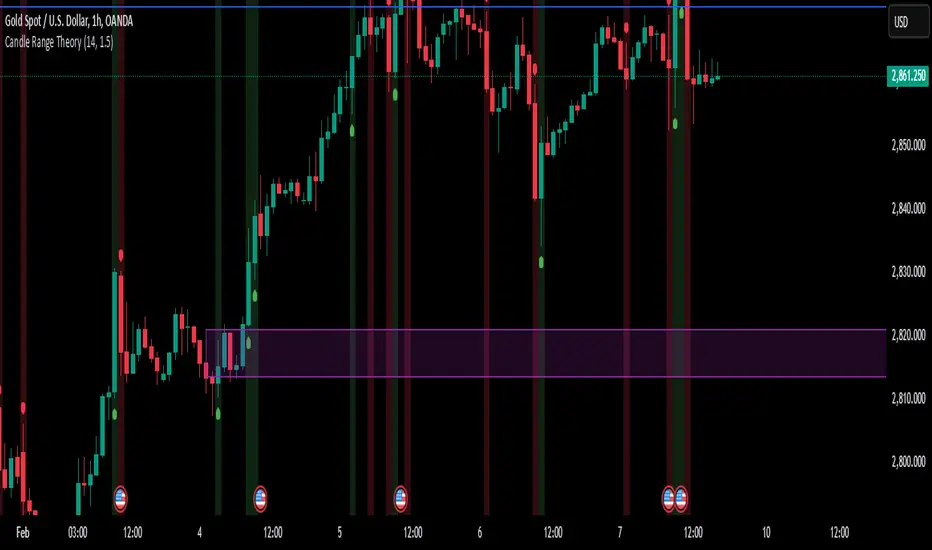
Candle Range Analysis:
Calculates the true range of each candle
Shows a 14-period SMA of the range (adjustable)
Dynamic bands based on standard deviation
Visual Components:
Colored histogram showing range deviations from mean
Signal line for oscillator smoothing
Expansion/contraction zones marked with dotted lines
Arrow markers for extreme range conditions
Key Functionality:
Identifies range expansion/contraction relative to historical volatility
Shows normalized range oscillator (-100% to +100% scale)
Includes visual and audio alerts for extreme range conditions
Customizable parameters for sensitivity and smoothing
Interpretation:
Red zones indicate above-average volatility/expansion
Green zones indicate below-average volatility/contraction
Crossings above/below zero line show range expansion/contraction
Signal line crossover system potential
Script de código aberto
Em verdadeiro espírito do TradingView, o criador deste script o tornou de código aberto, para que os traders possam revisar e verificar sua funcionalidade. Parabéns ao autor! Embora você possa usá-lo gratuitamente, lembre-se de que a republicação do código está sujeita às nossas Regras da Casa.
Aviso legal
As informações e publicações não se destinam a ser, e não constituem, conselhos ou recomendações financeiras, de investimento, comerciais ou de outro tipo fornecidos ou endossados pela TradingView. Leia mais nos Termos de Uso.