PROTECTED SOURCE SCRIPT
[TS] Enhanced MACD
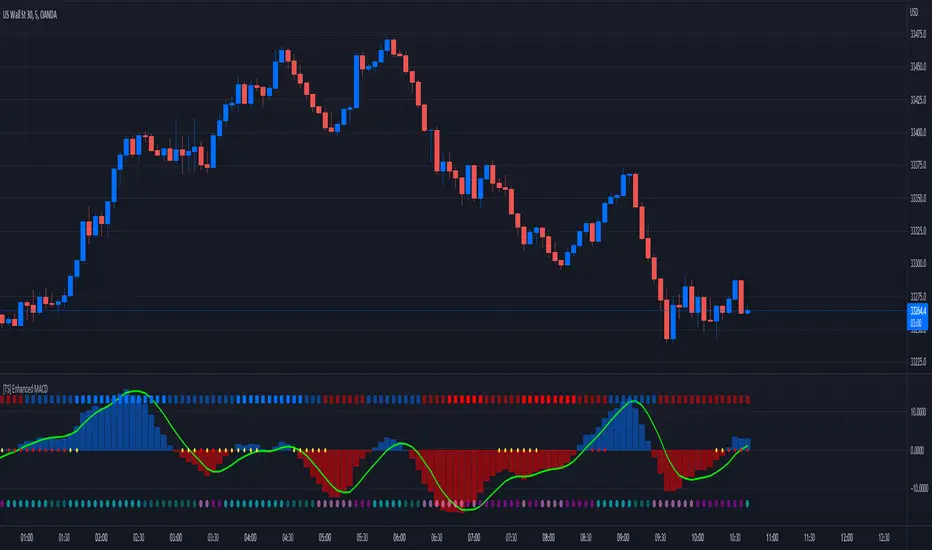
This is an Enhanced version of the standard MACD Indicator.
It displays the MACD Histogram as a normalized oscillator for a better visual representation (With values between -100 to 100)
On the top we have the WaveTrend indicator, showing the general trend of an asset (4 Color codings)
On 0 line, with red and yellow circles, is displayed the Contraption (or so-called Squeeze) of the price action.
When these circles appear a major shift in trend is expected.
On the bottom, we have another set of circles, which measure the price compression - These signal a period of very low price volatility.
Script protegido
Esse script é publicada como código fechado. No entanto, você pode gerenciar suas escolhas de bate-papo. Por favor, abra suas Configurações do perfil
Trusted Indicators
Visit: TrustedSignals.com or TrustedIndicators.com
Visit: TrustedSignals.com or TrustedIndicators.com
Aviso legal
As informações e publicações não se destinam a ser, e não constituem, conselhos ou recomendações financeiras, de investimento, comerciais ou de outro tipo fornecidos ou endossados pela TradingView. Leia mais nos Termos de Uso.