OPEN-SOURCE SCRIPT
Candle Breakdown with Solid Tops/Bottoms
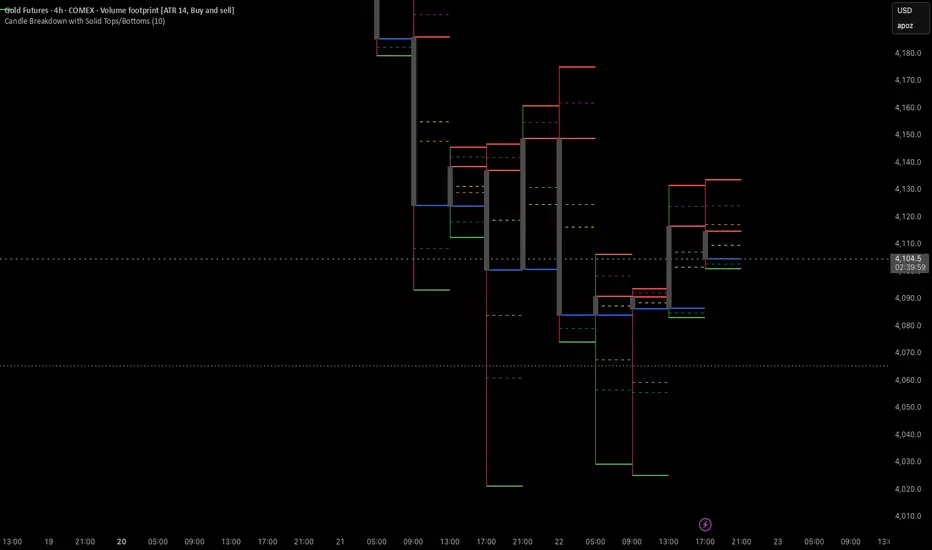
I incorporate this indicator on a 4hr chart and use the previous candle levels as support resistane/ targets/pivots for trades on the 1 min.
This Pine Script v5 indicator for TradingView, named "Candle Breakdown with Solid Tops/Bottoms," visually dissects each candlestick into four sections: whole candle (low to high), top wick (body top to high), body (open to close), and bottom wick (low to body bottom). For each section, it plots:Solid horizontal lines (width=2) at the top and bottom (e.g., high/low for whole candle, body top/bottom for body).
Dashed horizontal midlines (width=1) at the midpoint of each section (e.g., (high + low)/2 for whole candle).
Key features include:
Toggles: Enable/disable each section (whole, top wick, body, bottom wick) via checkboxes.
Custom Colors: Separate color inputs for top/bottom lines and midlines (defaults: gray, red, blue, green for sections; orange, purple, yellow, teal for midlines).
Lookback: User-defined input (default 10 candles) limits lines to the last N candles for clarity.
Labels: Optional price labels on the last bar for debugging.
The script uses line.new() for dynamic, per-candle lines, ensuring no errors (e.g., no invalid linestyle or linewidth<1). It’s efficient (up to 12 lines/candle, stays under max_lines_count=500) and works on any symbol/timeframe, enhancing swing trading analysis (e.g., for GC1! or NQ1!).
Script de código aberto
No verdadeiro espirito do TradingView, o autor desse script o publicou como código aberto, para que os traders possam entendê-lo e verificá-lo. Parabéns ao autor Você pode usá-lo gratuitamente, mas a reutilização desse código em publicações e regida pelas Regras da Casa.
Aviso legal
As informações e publicações não devem ser e não constituem conselhos ou recomendações financeiras, de investimento, de negociação ou de qualquer outro tipo, fornecidas ou endossadas pela TradingView. Leia mais em Termos de uso.