OPEN-SOURCE SCRIPT
Custom SMA Plot
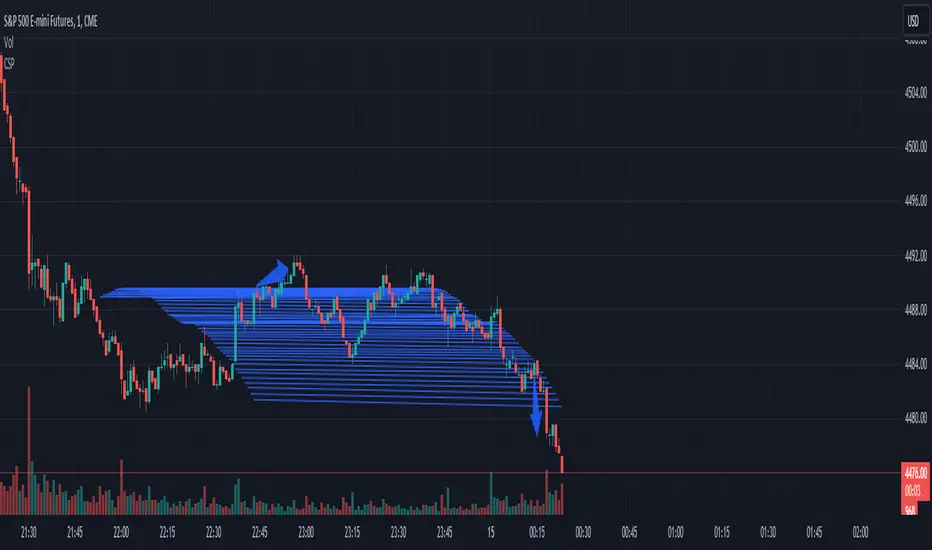
It creates a custom indicator named "Custom SMA Plot (CSP)" that overlays on a price chart. The indicator fetches the closing prices and calculates a 14-period simple moving average (SMA) of these prices. This SMA is then visually represented as a blue line, which starts from the SMA value of the bar 100 candles ago and extends to the current bar's SMA value. The line has a thickness of 1 unit.
When price breaks over wave go long.
When price breaks below wave go short.
When price breaks over wave go long.
When price breaks below wave go short.
Script de código aberto
Em verdadeiro espírito do TradingView, o criador deste script o tornou de código aberto, para que os traders possam revisar e verificar sua funcionalidade. Parabéns ao autor! Embora você possa usá-lo gratuitamente, lembre-se de que a republicação do código está sujeita às nossas Regras da Casa.
Aviso legal
As informações e publicações não se destinam a ser, e não constituem, conselhos ou recomendações financeiras, de investimento, comerciais ou de outro tipo fornecidos ou endossados pela TradingView. Leia mais nos Termos de Uso.