PROTECTED SOURCE SCRIPT
Enhanced Volume Spike Scanner
Enhanced Volume Spike Scanner – User Instructions
Overview
This TradingView indicator monitors the trading volume of a list of selected tickers and detects “volume spikes” by comparing the current volume against a simple moving average (SMA) of past volumes. It calculates a “spike strength” (the ratio of current volume to average volume) and assigns a color based on its intensity. The indicator then displays a sorted table on your chart with each ticker’s symbol, spike value, and current volume. Alerts can be triggered if a ticker’s spike strength reaches specific color-coded levels.
How It Works
1. Volume Calculation:
• For each ticker, the indicator fetches the current volume and calculates its simple moving average (SMA) over a user-defined lookback period.
• The ratio of the current volume to the SMA (spike strength) is computed.
2. Color Coding:
• A color is assigned based on the spike strength:
• >5.0: Orange
• >4.0: Yellow
• >3.0: Green
• >2.5: Lime
• >2.0: Blue
• Otherwise: Pink
• These colors serve as visual cues for the intensity of the volume spike.
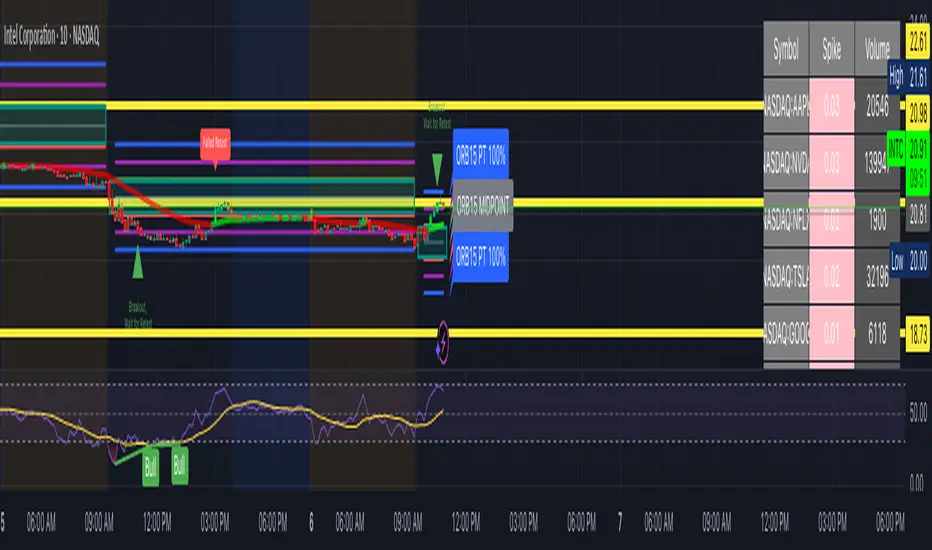
3. Table Display:
• All tickers are listed in a table on the chart.
• The table is sorted in descending order of spike strength so that the tickers with the strongest volume spikes appear at the top.
• Each row displays the ticker symbol, its spike value (formatted to two decimal places), and the current volume.
4. Alerts:
• You can enable alerts for each color level (e.g., Orange for the most intense spikes).
• Alerts trigger once per bar for any ticker that meets the criteria, allowing you to react promptly to significant volume changes.
⸻
User Inputs and Customization
• Volume Spike Multiplier:
Set the threshold for what constitutes a spike (e.g., a value of 2.0 means the current volume must be at least twice the SMA to be considered a spike).
• Volume Lookback Period:
Define how many bars to use when calculating the SMA of the volume.
• Minimum Volume Filter:
Optionally enable a filter to ignore low-volume ticks. Specify the minimum volume that must be reached for a ticker to be considered.
• Table Settings:
Adjust parameters like column width, table number, and vertical positioning to suit your chart layout.
• Alert Settings:
Toggle alerts for each spike intensity level. Only tickers that meet the specified color threshold will trigger an alert.
• Color Inputs:
Customize the colors for each spike intensity level using the color input settings.
• Ticker Inputs:
Update the ticker symbols manually in the input section (Ticker 1, Ticker 2, etc.) to monitor the assets you are interested in.
⸻
Using the Indicator
1. Add the Indicator:
Once added to your chart, the table will appear at the top-right corner. You can reposition it using the “Table Number” or “Move Down” inputs.
2. Monitor the Table:
Watch the table update each bar:
• The Symbol column lists your selected tickers.
• The Spike column shows the spike strength along with its corresponding color (indicating intensity).
• The Volume column shows the current volume for each ticker.
3. React to Alerts:
If you have enabled alerts for a specific intensity, you’ll receive a notification (once per bar) when a ticker reaches that volume spike level.
4. Adjust Settings as Needed:
Experiment with the multipliers, lookback periods, and minimum volume thresholds to fine-tune the indicator for your trading style.
⸻
Overview
This TradingView indicator monitors the trading volume of a list of selected tickers and detects “volume spikes” by comparing the current volume against a simple moving average (SMA) of past volumes. It calculates a “spike strength” (the ratio of current volume to average volume) and assigns a color based on its intensity. The indicator then displays a sorted table on your chart with each ticker’s symbol, spike value, and current volume. Alerts can be triggered if a ticker’s spike strength reaches specific color-coded levels.
How It Works
1. Volume Calculation:
• For each ticker, the indicator fetches the current volume and calculates its simple moving average (SMA) over a user-defined lookback period.
• The ratio of the current volume to the SMA (spike strength) is computed.
2. Color Coding:
• A color is assigned based on the spike strength:
• >5.0: Orange
• >4.0: Yellow
• >3.0: Green
• >2.5: Lime
• >2.0: Blue
• Otherwise: Pink
• These colors serve as visual cues for the intensity of the volume spike.
3. Table Display:
• All tickers are listed in a table on the chart.
• The table is sorted in descending order of spike strength so that the tickers with the strongest volume spikes appear at the top.
• Each row displays the ticker symbol, its spike value (formatted to two decimal places), and the current volume.
4. Alerts:
• You can enable alerts for each color level (e.g., Orange for the most intense spikes).
• Alerts trigger once per bar for any ticker that meets the criteria, allowing you to react promptly to significant volume changes.
⸻
User Inputs and Customization
• Volume Spike Multiplier:
Set the threshold for what constitutes a spike (e.g., a value of 2.0 means the current volume must be at least twice the SMA to be considered a spike).
• Volume Lookback Period:
Define how many bars to use when calculating the SMA of the volume.
• Minimum Volume Filter:
Optionally enable a filter to ignore low-volume ticks. Specify the minimum volume that must be reached for a ticker to be considered.
• Table Settings:
Adjust parameters like column width, table number, and vertical positioning to suit your chart layout.
• Alert Settings:
Toggle alerts for each spike intensity level. Only tickers that meet the specified color threshold will trigger an alert.
• Color Inputs:
Customize the colors for each spike intensity level using the color input settings.
• Ticker Inputs:
Update the ticker symbols manually in the input section (Ticker 1, Ticker 2, etc.) to monitor the assets you are interested in.
⸻
Using the Indicator
1. Add the Indicator:
Once added to your chart, the table will appear at the top-right corner. You can reposition it using the “Table Number” or “Move Down” inputs.
2. Monitor the Table:
Watch the table update each bar:
• The Symbol column lists your selected tickers.
• The Spike column shows the spike strength along with its corresponding color (indicating intensity).
• The Volume column shows the current volume for each ticker.
3. React to Alerts:
If you have enabled alerts for a specific intensity, you’ll receive a notification (once per bar) when a ticker reaches that volume spike level.
4. Adjust Settings as Needed:
Experiment with the multipliers, lookback periods, and minimum volume thresholds to fine-tune the indicator for your trading style.
⸻
Script protegido
Esse script é publicada como código fechado. No entanto, você pode gerenciar suas escolhas de bate-papo. Por favor, abra suas Configurações do perfil
Aviso legal
As informações e publicações não se destinam a ser, e não constituem, conselhos ou recomendações financeiras, de investimento, comerciais ou de outro tipo fornecidos ou endossados pela TradingView. Leia mais nos Termos de Uso.