PROTECTED SOURCE SCRIPT
π Cycle Market Tops & Bottoms Performante Indicator
Why is it called the Pi Cycle Tops & Bottoms Indicator?
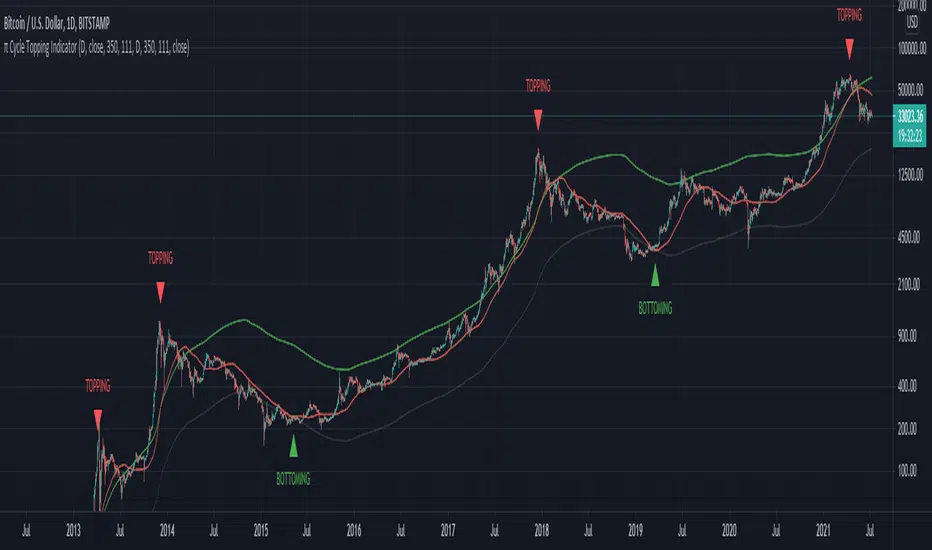
When the 111-Day moving average crosses over the (350-Day moving average X 2), we've seen the price come to a key top or bottom within the Bitcoin market for the past 3 cycles.
350 divided by 111 is very close to π - hence the name the Pie cycle!
Yes, we are selecting arbitrary numbers initially, but through the use of proper back-testing, we are able to find key cycle shifts using mathematical numbers (fibs, Pi, etc)
We use this topping & bottoming signal when things look overbought over oversold within the market.
The "topping" label turns on as soon as we see the 111-Day moving average cross above the 350-Day moving average.
The "bottoming" signal turns on as soon as we see the 111-day moving average cross below the 350-Day moving average.
This indicator should only be used on the daily timeframe!
Historically speaking, we've seen this indicator become impressively accurate.
Script protegido
Esse script é publicada como código fechado. No entanto, você pode gerenciar suas escolhas de bate-papo. Por favor, abra suas Configurações do perfil
Aviso legal
As informações e publicações não se destinam a ser, e não constituem, conselhos ou recomendações financeiras, de investimento, comerciais ou de outro tipo fornecidos ou endossados pela TradingView. Leia mais nos Termos de Uso.