OPEN-SOURCE SCRIPT
Atualizado Uptrick: Bullish/Bearish Highlight -DEMO
1 Indicator Purpose:
• The indicator serves as a technical analysis tool for traders to identify potential bullish
and bearish trends in the market.
• It highlights periods where the closing price is above or below a 50-period simple
moving average (SMA), indicating potential bullish or bearish sentiment, respectively.
2 Moving Averages:
• The indicator calculates a 50-period SMA (sma50) to smooth out price fluctuations
and identify the overall trend direction.
• It also computes an 8-period exponential moving average (EMA), which responds
more quickly to recent price changes compared to the SMA.
3 Bollinger Bands:
• Bollinger Bands are plotted around the SMA, indicating volatility in the price
movement.
• The bands are typically set at two standard deviations above and below the SMA,
representing approximately 95% of the price data within that range.
4 Bullish and Bearish Conditions:
• The indicator defines conditions for identifying bullish and bearish market sentiments.
• When the closing price is above the SMA50, it indicates a bullish condition, and when
it's below, it suggests a bearish condition.
5 Plotting:
• The indicator visualizes the bullish and bearish conditions by changing the
background color accordingly.
• It also plots the SMA50, EMA, and Bollinger Bands to provide a graphical
representation of the market dynamics.
6 User Interface:
• The indicator is designed to be used as an overlay on price charts, allowing traders to
easily incorporate it into their analysis.
Overall, the "Uptrick: Bullish/Bearish Highlight" indicator offers traders a comprehensive view of market trends and potential reversal points, helping them make informed trading decisions.
TIP: When the white line, which is the EMA , crosses above the SMA (the orange line), it is usually a good idea to buy, but when the EMA crosses below the SMA it is a good idea to sell.
Notas de Lançamento
In this update, I just added histogram bars into the background.Notas de Lançamento
This is not really a update because here I just changed the cover image.Notas de Lançamento
This script, titled "Uptrick: Bullish/Bearish Highlight," is a TradingView Pine Script indicator that helps identify bullish and bearish conditions by using a combination of technical analysis tools. It overlays on the chart and generates signals based on moving averages, volatility bands, multi-timeframe analysis, and asset correlation.The script uses *smaLength*, *emaLength*, and *atrLength* to calculate the Simple Moving Average (SMA), Exponential Moving Average (EMA), and Average True Range (ATR), respectively. The ATR is adjusted by *atrMultiplier* to create dynamic bands that act as support and resistance levels. The *higherTimeframe* parameter confirms the trend on a larger timeframe, while *correlationAsset* and *correlationPeriod* check if the asset is moving in correlation with another asset. The script also includes a pyramiding option for allowing multiple positions in the same direction.
### Validation:
The script ensures valid input values for *smaLength*, *emaLength*, and *atrLength*, raising an error if any of them are set incorrectly.
### Calculations:
- The script calculates SMA, EMA, and ATR, adjusting the ATR bands for market volatility.
- It uses multi-timeframe analysis to confirm trends and measures the correlation between the asset and another asset (e.g., BTCUSDT).
- Signal strength is determined based on the price difference from the SMA compared to market noise.
### Signal Conditions:
- A bullish signal occurs when the price is above both the SMA and the higher timeframe SMA.
- A bearish signal is generated when the price is below both the SMA and the higher timeframe SMA.
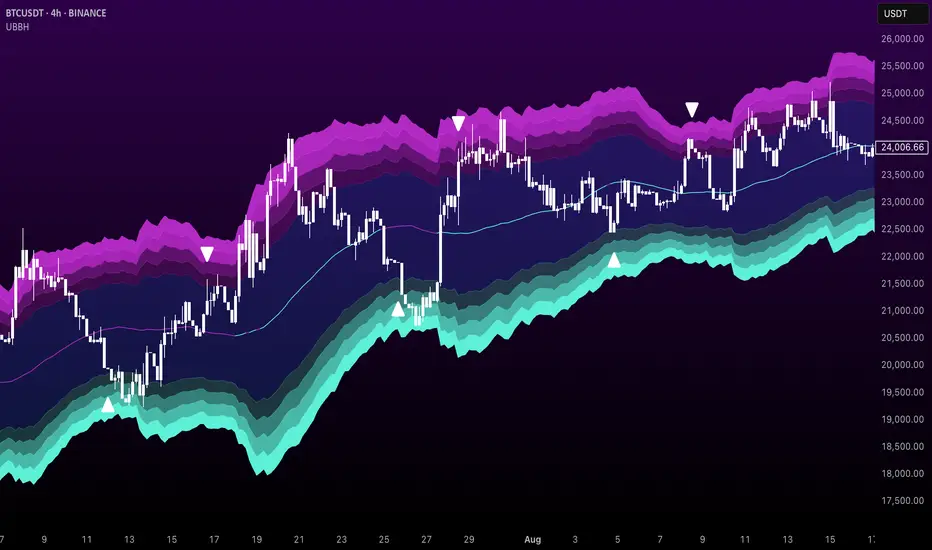
### Visualization:
ATR bands are plotted, and the area between them is filled with a blue cloud. The SMA’s color changes based on the trend of the asset and the correlated asset.
### Pyramiding Logic:
If pyramiding is enabled, new positions are allowed in the same direction; otherwise, positions are restricted until the market changes direction.
### Entry and Exit Levels:
The script defines buy and sell signals based on price touching the defined ATR levels.
### Alerts:
Custom alerts can be set based on price touching key levels or when buy/sell signals are generated.
### Uniqueness:
This script combines multiple features like dynamic ATR bands, multi-timeframe analysis, and multi-asset correlation. The ATR bands adjust with volatility, and the higher timeframe SMA adds confirmation. Smart signal filtering and pyramiding options give flexibility and precision, while the SMA color change enhances trend visibility.
---
### How to Use:
1. Using it as support and resistance:
The ATR bands act as dynamic support and resistance levels. Watch for price to interact with these levels to identify potential reversals or breakouts.
2. Buying if the price gets below all layers and selling if the price gets above all layers:
Enter buy trades when the price touches and moves above all lower ATR levels, and enter sell trades when the price moves above all upper ATR levels.
3. Tight cloud indicates breakout, wide cloud indicates consolidation:
When the ATR cloud is tight, it suggests low volatility and a potential breakout. A wide cloud signals high volatility, indicating a cooling-off period or consolidation.
Notas de Lançamento
Updated color scheme.Script de código aberto
Em verdadeiro espírito do TradingView, o criador deste script o tornou de código aberto, para que os traders possam revisar e verificar sua funcionalidade. Parabéns ao autor! Embora você possa usá-lo gratuitamente, lembre-se de que a republicação do código está sujeita às nossas Regras da Casa.
💎 Free Discord: discord.gg/Def47ueyuD
💎 Website: uptrick.io
Nothing is financial advice. Always do your own research.
💎 Website: uptrick.io
Nothing is financial advice. Always do your own research.
Aviso legal
As informações e publicações não se destinam a ser, e não constituem, conselhos ou recomendações financeiras, de investimento, comerciais ou de outro tipo fornecidos ou endossados pela TradingView. Leia mais nos Termos de Uso.
Script de código aberto
Em verdadeiro espírito do TradingView, o criador deste script o tornou de código aberto, para que os traders possam revisar e verificar sua funcionalidade. Parabéns ao autor! Embora você possa usá-lo gratuitamente, lembre-se de que a republicação do código está sujeita às nossas Regras da Casa.
💎 Free Discord: discord.gg/Def47ueyuD
💎 Website: uptrick.io
Nothing is financial advice. Always do your own research.
💎 Website: uptrick.io
Nothing is financial advice. Always do your own research.
Aviso legal
As informações e publicações não se destinam a ser, e não constituem, conselhos ou recomendações financeiras, de investimento, comerciais ou de outro tipo fornecidos ou endossados pela TradingView. Leia mais nos Termos de Uso.