OPEN-SOURCE SCRIPT
Relative Price Oscillator
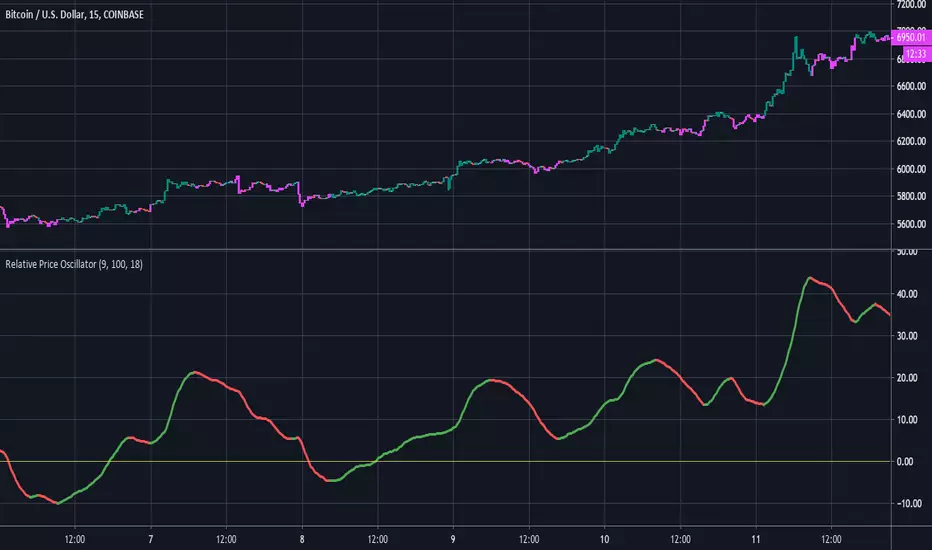
Here is a new experimental indicator we've been working on. The idea was to compare two EMA's of period midpoints to the actual closing price. The steps that were taken are listed below:
1.Calculate an EMA based on each period's midpoint ((High * Low) /2) for the last 9 periods.
2.Calculate an EMA based on each period's midpoint for the last 100 periods.
3. Divide the difference of the two EMA's by the closing price. ((EMA1 - EMA2) / Close).
4. Smooth the value from step #3 with an 18 period EMA. Multiply by 1000 for better scaling/visibility.
Using:
Bullish when line is green, bearish when line is red. Buy on first green, then sell on first red.
There is also an option to color the candles based on the RPO line.
Script de código aberto
Em verdadeiro espírito do TradingView, o criador deste script o tornou de código aberto, para que os traders possam revisar e verificar sua funcionalidade. Parabéns ao autor! Embora você possa usá-lo gratuitamente, lembre-se de que a republicação do código está sujeita às nossas Regras da Casa.
-Profit Programmers
profitprogrammer.com
profitprogrammer.com
Aviso legal
As informações e publicações não se destinam a ser, e não constituem, conselhos ou recomendações financeiras, de investimento, comerciais ou de outro tipo fornecidos ou endossados pela TradingView. Leia mais nos Termos de Uso.