OPEN-SOURCE SCRIPT
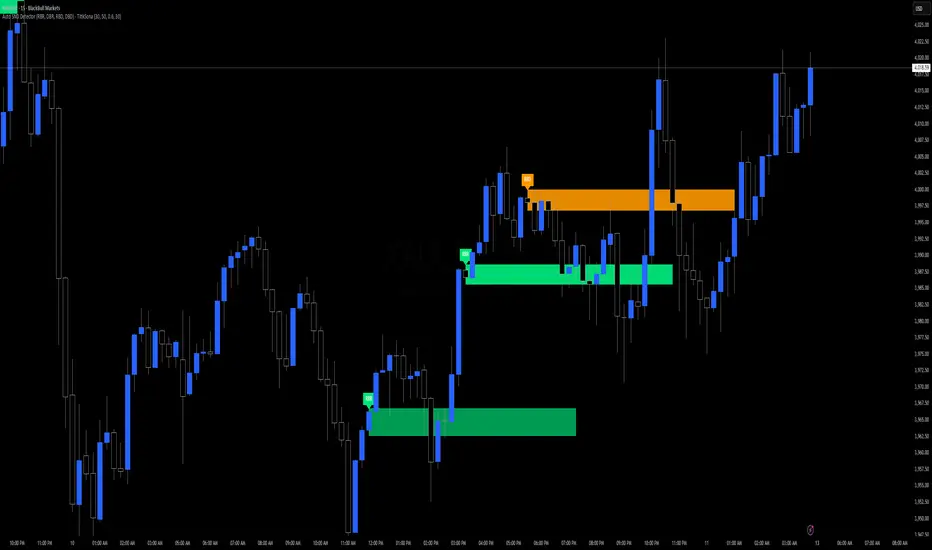
Auto SND Detector (RBR, DBR, RBD, DBD) - TitikSona
🧠 Description
Auto SND Detector (RBR, DBR, RBD, DBD) – TitikSona
This indicator automatically detects Supply and Demand (SND) zones based on four classical price patterns:
🔵 RBR (Rally–Base–Rally) – Potential Demand Continuation
🟢 DBR (Drop–Base–Rally) – Potential Demand Reversal
🟠 RBD (Rally–Base–Drop) – Potential Supply Reversal
🔴 DBD (Drop–Base–Drop) – Potential Supply Continuation
The indicator identifies small base candles between two larger opposing candles, following the classical SND concept, and draws zone boxes automatically.
Box colors indicate the type of zone:
🟩 Light Green → RBR
🟦 Teal → DBR
🟧 Orange → RBD
🟥 Red → DBD
⚙️ How It Works
- Analyzes three consecutive candles (left, base, right) to detect structures like Rally–Base–Drop or Drop–Base–Rally.
- The middle candle (base) is considered valid if its size is smaller than a specified percentage (Base max % of avg range), indicating a consolidation area.
- Zones are drawn automatically and extended several bars to the right (Box extend).
- Optional labels and colors help quickly identify each pattern.
📈 Key Features
- Automatic detection of four main SND patterns
- Colored zones for quick visual identification
- Optional zone labels for easier reference
- Built-in alerts for detected patterns
- Adjustable parameters: base sensitivity, lookback, and zone length
💡 Usage Tips
- Best used on H1 or higher timeframes (H4/D1) for cleaner zone identification
- Combine with other analysis techniques, such as trend filters (EMA 50/200) or market structure, for context
- Zones can be used as a **visual reference** for potential areas of supply and demand, but should not be interpreted as guaranteed entry signals
🧩 Main Parameters
- Base max % of avg range → Sensitivity for base size
- Lookback bars → Number of candles analyzed backward
- Box extend → How far the zone extends to the right
- Show labels → Display pattern labels
📢 Notes
- This indicator is **informational and educational**
- Always use additional confirmation (price action, volume, trend indicators) before making any trading decisions
- Past patterns do not guarantee future price movements
Script de código aberto
No verdadeiro espirito do TradingView, o autor desse script o publicou como código aberto, para que os traders possam entendê-lo e verificá-lo. Parabéns ao autor Você pode usá-lo gratuitamente, mas a reutilização desse código em publicações e regida pelas Regras da Casa.
Aviso legal
As informações e publicações não devem ser e não constituem conselhos ou recomendações financeiras, de investimento, de negociação ou de qualquer outro tipo, fornecidas ou endossadas pela TradingView. Leia mais em Termos de uso.