OPEN-SOURCE SCRIPT
Atualizado Auto-Support
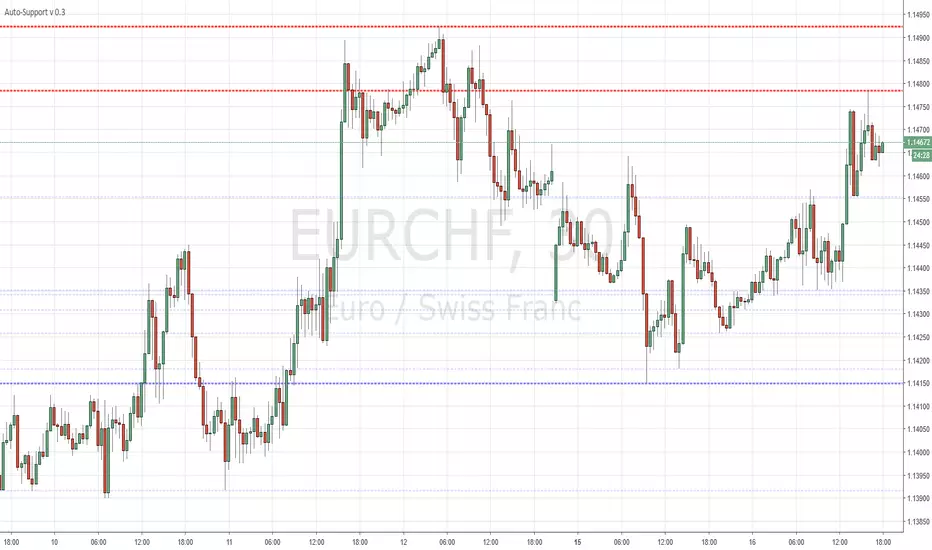
Fairly simple script that automatically draws highs and lows for the past X periods at various intervals.
3 Settings :
"Sensitivity" which amounts to the horizontal separation from one high to the next high (default multiplicator : 10)
Variable "b" which is the HEX color for resistances (default : red)
Variable "c" which is the HEX color for supports (default : blue)
More HEX color codes on hexcolortool.com/ (not my webpage :)
Feel free to edit the script to your taste.
Notas de Lançamento
*** Bug Fix version after today's error message issues ****Anyone using previous versions is strongly advised to update
> Removed some higher s/r levels from the code
> Sensitivity can now only be set between 1 - 10, higher numbers cause the script to fail to load
***********************************************************************
Fairly simple script that automatically draws highs and lows for the past X periods at various intervals.
3 Settings :
"Sensitivity" which amounts to the horizontal separation from one high to the next high (default multiplicator : 10)
"Transparency" ... Multiple lines piling up at the same level will cause the s/r levels to be more or less visible.
Variable "b" which is the HEX color for resistances (default : red)
Variable "c" which is the HEX color for supports (default : blue)
More HEX color codes on hexcolortool.com/ (not my webpage :)
Feel free to edit the script to your taste.
Script de código aberto
Em verdadeiro espírito do TradingView, o criador deste script o tornou de código aberto, para que os traders possam revisar e verificar sua funcionalidade. Parabéns ao autor! Embora você possa usá-lo gratuitamente, lembre-se de que a republicação do código está sujeita às nossas Regras da Casa.
Aviso legal
As informações e publicações não se destinam a ser, e não constituem, conselhos ou recomendações financeiras, de investimento, comerciais ou de outro tipo fornecidos ou endossados pela TradingView. Leia mais nos Termos de Uso.