OPEN-SOURCE SCRIPT
Atualizado Impulse Candle with Volume & Std Analysis
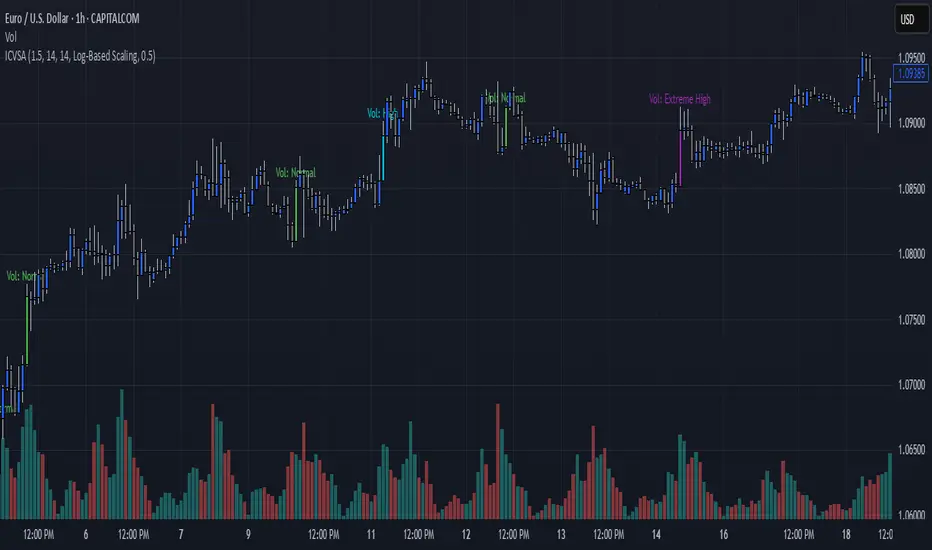
Impulse Candle with Volume & Std Analysis
This indicator highlights “impulse” candles on your chart by combining price action and volume analysis to gauge the strength of market moves.
How It Works:
Impulse Candle Detection:
The indicator measures the candle’s body size and compares it to the Average True Range (ATR). When a candle’s body exceeds a user-defined multiple of the ATR (the “Impulse Factor”), it is flagged as an impulse candle.
Volume Analysis:
For each impulse candle, the indicator calculates the expected volume (Impulse Factor × average volume) and compares the actual volume against this expected value. It uses the standard deviation of volume over a specified period to classify the move’s volume as:
Extreme Low: More than 2 standard deviations below the expected volume
Low: Between 1 and 2 standard deviations below expected
Normal: Within 1 standard deviation of expected volume
High: Between 1 and 2 standard deviations above expected
Extreme High: More than 2 standard deviations above expected
Visual Cues:
The impulse candles are color-coded based on the volume classification.
A text-only label (with customizable text color) appears just above each impulse candle, indicating its volume category. The label has no background, ensuring a clean, unobtrusive look.
Customization:
Users can adjust parameters such as the Impulse Factor, ATR length, and volume averaging period to tailor the indicator to their trading style.
This tool is perfect for traders who want a quick visual representation of both significant price moves and the corresponding volume strength behind those moves.
Notas de Lançamento
Impulse Candle with Volume & Standard Deviation AnalysisThis indicator visually identifies “impulse” candles and evaluates the strength of market moves by combining price action analysis with a dynamic volume approach.
How It Works:
Impulse Candle Detection:
The indicator calculates the absolute body size of a candle (the difference between close and open).
It compares this body size to the Average True Range (ATR) over a user-defined period.
When the candle’s body exceeds a user-defined multiple of the ATR—determined by the Impulse Factor—it is flagged as an impulse candle, signaling a strong move relative to recent volatility.
Dynamic Volume Analysis:
Rather than simply using Impulse Factor × Average Volume, the expected volume is computed dynamically using the move’s strength:
Expected Volume = (Body Size / ATR) × Average Volume
This calculation scales the expected volume based on the relative magnitude of the candle’s move.
The actual volume is then compared against this expected volume.
Using the standard deviation of volume over a specified period, the indicator classifies the move’s volume as follows:
Extreme Low: More than 2 standard deviations below expected volume
Low: Between 1 and 2 standard deviations below expected volume
Normal: Within 1 standard deviation of expected volume
High: Between 1 and 2 standard deviations above expected volume
Extreme High: More than 2 standard deviations above expected volume
Visual Cues:
Impulse candles are color-coded based on their volume classification.
A clean, text-only label appears above each flagged candle, indicating its volume category. This design ensures the chart remains uncluttered and easy to interpret.
Customization:
Users can adjust key parameters such as the Impulse Factor, ATR length, and volume averaging period to suit their trading style and market conditions.
Application:
This indicator is ideal for traders who want a quick, visual representation of significant price moves and the volume supporting these moves. It helps determine whether a move is not only large in price but also backed by appropriate volume, aiding in more informed decision-making.
Notas de Lançamento
1. Flexible Expected Volume CalculationNew Input Selector:
A new drop-down input—expectedVolumeMethod—has been added. This lets users choose among several methods to compute the expected volume, ensuring the indicator is adaptable to different trading strategies. The available options are:
Fixed Multiplier: Expected volume is derived by multiplying the average volume by the impulse factor.
Average Only: The expected volume is simply the average volume, decoupling it completely from the size of the candle.
Log-Based Scaling: Uses a logarithmic function to adjust the expected volume based on how the current candle’s body size compares with the ATR, moderated by a scaling factor (alpha).
Hybrid (volAvg + Multiplier*volStd): Combines the average volume with a multiple of its standard deviation, providing dynamic thresholds that account for recent volume variability.
2. Implementation Details
Conditional Calculations:
The expected volume is now calculated using an if/else statement that checks the selected method. This modular approach makes it easy for users to switch between methodologies without modifying the underlying logic.
Log-Based Scaling Specifics:
When the Log-Based option is chosen, the indicator uses the formula:
pinescript
Copy
expectedVolume = volAvg * (1 + alpha * math.log(1 + bodySize / atrValue))
This approach gently adjusts the expected volume for larger moves while preventing runaway values that could occur with a direct proportion.
Hybrid Option:
For added flexibility, the Hybrid method calculates expected volume as:
pinescript
Copy
expectedVolume = volAvg + impulseFactor * volStd
This provides a dynamic baseline that not only considers the average but also includes the market’s recent volume variability.
Script de código aberto
Em verdadeiro espírito do TradingView, o criador deste script o tornou de código aberto, para que os traders possam revisar e verificar sua funcionalidade. Parabéns ao autor! Embora você possa usá-lo gratuitamente, lembre-se de que a republicação do código está sujeita às nossas Regras da Casa.
Aviso legal
As informações e publicações não se destinam a ser, e não constituem, conselhos ou recomendações financeiras, de investimento, comerciais ou de outro tipo fornecidos ou endossados pela TradingView. Leia mais nos Termos de Uso.