PROTECTED SOURCE SCRIPT
RSI de Loquy
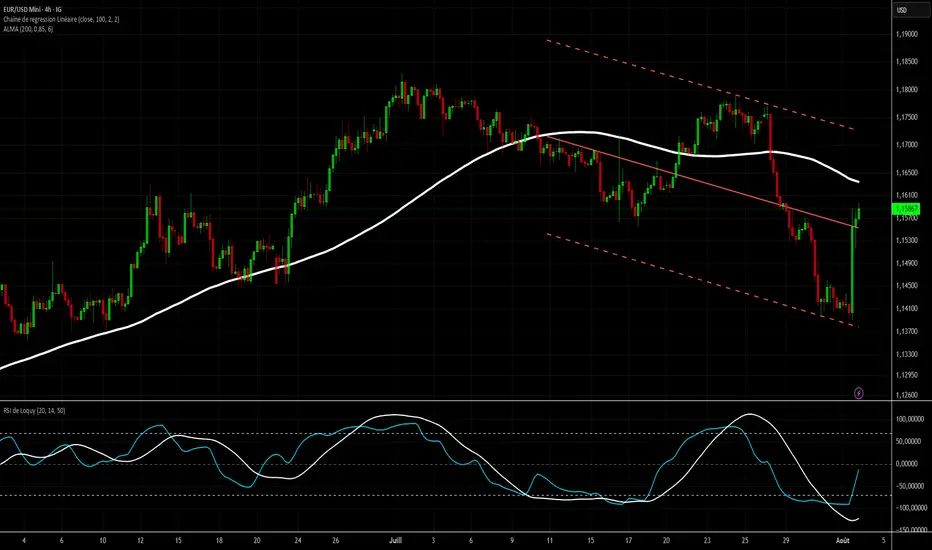
Indicator Description: RSI de Loquy
This custom indicator blends the power of the Relative Strength Index (RSI) with the Hull Moving Average (HMA), enhanced by a linear regression to reveal underlying momentum trends.
How It Works:
The RSI is calculated not on price directly, but on the HMA, offering a smoother and more responsive signal.
The RSI is remapped to a -100 to +100 scale for more intuitive reading:
+100 = extreme oversold
-100 = extreme overbought
A linear regression line is plotted over the rescaled RSI to highlight trend direction and strength.
Usage Tips:
Reversed overbought/oversold levels:
Above +70 = potential oversold condition
Below -70 = potential overbought condition
The white regression line helps confirm trend shifts or momentum continuation.
⚙️ Customizable Inputs:
HMA period
RSI length
Regression length
Script protegido
Esse script é publicada como código fechado. No entanto, você pode gerenciar suas escolhas de bate-papo. Por favor, abra suas Configurações do perfil
Aviso legal
As informações e publicações não se destinam a ser, e não constituem, conselhos ou recomendações financeiras, de investimento, comerciais ou de outro tipo fornecidos ou endossados pela TradingView. Leia mais nos Termos de Uso.