PROTECTED SOURCE SCRIPT
Atualizado Wyckoff Detector - BidWhales

Wyckoff Detector - BidWhales
Description:
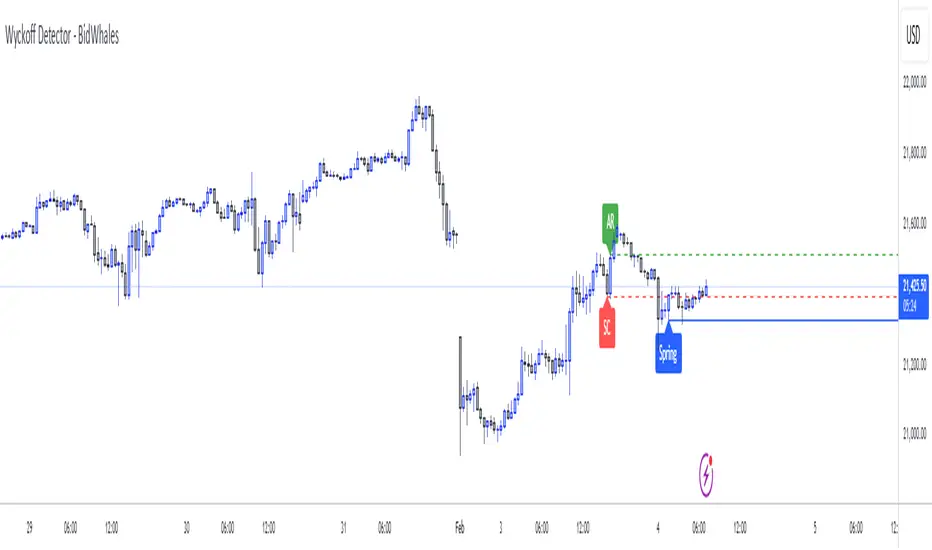
I was searching for a powerful Wyckoff indicator on TradingView but couldn’t find one that met my standards. So, I built the Wyckoff Detector - BidWhales, a tool designed to detect live Wyckoff phases and provide visual cues for traders.
---
What is it?
The Wyckoff Detector identifies and visualizes Wyckoff Accumulation and Distribution phases, helping traders spot key turning points in the market. This indicator assists with recognizing essential Wyckoff components like:
- Accumulation (Bullish):
- Selling Climax (SC)
- Automatic Rally (AR)
- Spring
- Sign of Strength (SOS)
- Distribution (Bearish):
- Buying Climax (BC)
- Automatic Reaction (AR)
- Upthrust (UT)
- Sign of Weakness (SOW)
The script is programmed to display these key phases on your chart with labels, dashed lines, and confirmations based on price action and volume.
---
Features:
1. Customizable Inputs:
- Swing Length: Determines the range for detecting climaxes and turning points.
- Volume Climax Multiplier: Adjusts the sensitivity of volume spikes for phase confirmation.
- Error Threshold (%): Controls the margin for phase detection accuracy.
- Minimum Delay Bars: Ensures phases occur with sufficient spacing for reliability.
- Wick Rejection Ratio: Confirms validity of springs and upthrusts with wick-to-body analysis.
2. Automated Phase Detection:
- Dynamically identifies Wyckoff components like SC, AR, Spring, SOS, BC, AR, UT, and SOW.
- Provides labels and horizontal lines to track phases visually.
3. Failure Logic:
- Phases invalidate upon predefined conditions:
- Close below Spring wick for bullish failure.
- Close above Upthrust wick for bearish failure.
- Time-based expiration (Max Bars Back) for stale patterns.
4. Volume Confirmation:
- Volume spikes (climax) are analyzed relative to a moving average, ensuring more accurate phase detection.
5. Clean Visuals:
- Labels and lines are plotted clearly on the chart, helping traders recognize patterns without clutter.
---
How to Use:
1. Add the indicator to your chart.
2. Adjust parameters like Swing Length and Volume Multiplier to suit your timeframe and trading style.
3. Look for Accumulation phases for potential bullish signals and Distribution phases for bearish signals.
4. Use the displayed labels and lines (SC, AR, Spring, etc.) to confirm Wyckoff patterns.
---
Disclaimer:
This indicator is a tool for educational purposes only. It is not financial advice. Always conduct your own analysis before making trading decisions.
---
Script License:
This Pine Script™ code is subject to the terms of the Mozilla Public License 2.0 at [mozilla.org/MPL/2.0/](https://mozilla.org/MPL/2.0/).
© ProfitSync
Notas de Lançamento
Release 02/04/2025Add Alerts
alert(labelText + " detected at " + str.tostring(price), alert.freq_once_per_bar_close)
Enjoy everyone :)
Script protegido
Esse script é publicada como código fechado. No entanto, você pode gerenciar suas escolhas de bate-papo. Por favor, abra suas Configurações do perfil
Aviso legal
As informações e publicações não se destinam a ser, e não constituem, conselhos ou recomendações financeiras, de investimento, comerciais ou de outro tipo fornecidos ou endossados pela TradingView. Leia mais nos Termos de Uso.