OPEN-SOURCE SCRIPT
Variable Index Dynamic Average (VIDYA) with Histper
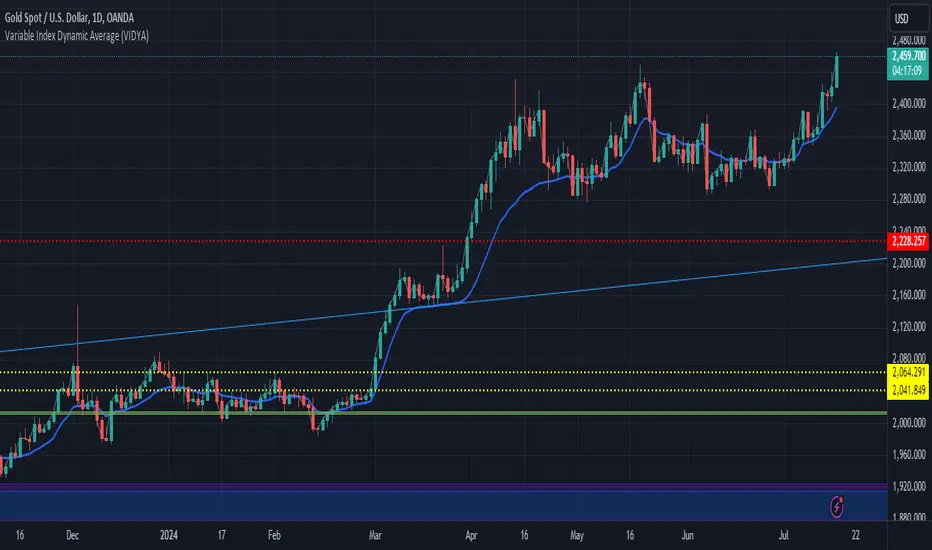
The Variable Index Dynamic Average (VIDYA) is a unique and adaptive moving average indicator designed to respond dynamically to market volatility. It adjusts its smoothing factor based on the standard deviation of price changes, making it more responsive during periods of high volatility and smoother during periods of low volatility. This version includes two key parameters:
Period: The number of bars used to calculate the VIDYA.
HistPer: The number of historical bars used to calculate the standard deviation, affecting the smoothness and responsiveness of the indicator.
Features:
Dynamic Adaptation: VIDYA adjusts its responsiveness based on market conditions, providing a balance between smoothness and responsiveness.
Customizable Parameters: Users can customize the Period and HistPer to fit their specific trading style and asset characteristics.
Overlay on Price Chart: The VIDYA is plotted directly on the price chart for easy visualization and integration with other technical analysis tools.
Usage:
Trend Identification: Use VIDYA to identify the prevailing trend. A rising VIDYA line indicates an uptrend, while a falling VIDYA line indicates a downtrend.
Entry and Exit Signals: Combine VIDYA with other indicators and trading strategies to confirm entry and exit signals.
Volatility Analysis: Adjust the HistPer to see how the indicator responds to different levels of market volatility.
Script de código aberto
Em verdadeiro espírito do TradingView, o criador deste script o tornou de código aberto, para que os traders possam revisar e verificar sua funcionalidade. Parabéns ao autor! Embora você possa usá-lo gratuitamente, lembre-se de que a republicação do código está sujeita às nossas Regras da Casa.
Aviso legal
As informações e publicações não se destinam a ser, e não constituem, conselhos ou recomendações financeiras, de investimento, comerciais ou de outro tipo fornecidos ou endossados pela TradingView. Leia mais nos Termos de Uso.