OPEN-SOURCE SCRIPT
Atualizado Cumulative Volume Delta Candles Aggregated (Lite)

Cumulative Volume Delta Candles Aggregated (Lite)
Multi-Exchange CVD Visualization in Candle Format
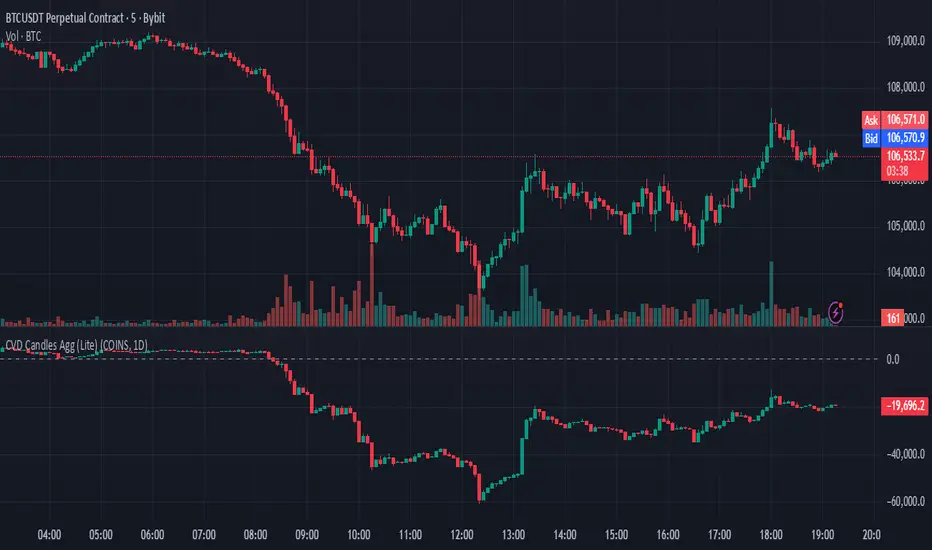
This indicator provides an aggregated Cumulative Volume Delta (CVD) view across multiple major perpetual futures exchanges in one chart. It is designed for traders who want a broader perspective on buying and selling pressure without switching between multiple charts or relying on a single exchange feed.
What It Does
Combines volume delta data from Binance, Bybit, OKX, Bitget, and Coinbase into a unified representation.
Displays CVD as candlesticks, where each candle reflects the open, high, low, and close of cumulative delta for the selected period.
Offers a clear visual of how buying and selling pressure evolves across markets in a structured, familiar candle format.
Key Features
✔ Exchange Aggregation: Incorporates data from several top futures markets available on TradingView.
✔ Anchor Reset: Allows you to set an anchor timeframe (e.g., daily) to reset cumulative values for better readability and analysis.
✔ Unit Normalization: Since exchanges report volumes in different units, the indicator normalizes all data and outputs values denominated in the base currency (coins) for consistency.
✔ Hidden OHLC Outputs: Provides open, high, low, and close values as hidden plots for use with other indicators or strategies.
✔ Lightweight Design: Optimized for efficiency while handling multiple real-time data requests.
Why It’s Different
Unlike standard single-exchange CVD tools, this indicator aggregates the majority of perpetual volume data available on TradingView, offering a more representative view of market sentiment. The candle-based representation of CVD introduces an additional layer of structure, helping traders identify shifts in momentum and pressure with more context than a simple cumulative line.
Use Cases
- Spotting aggregated buy/sell pressure trends across multiple exchanges.
- Confirming breakout or reversal signals with broader volume delta context.
- Serving as a custom data source for other indicators or algorithmic strategies.
Notas de Lançamento
Changes in Version 2:- Added option to change denomination into the base currency (COINS) or USD.
- Added vertical lines to show anchor period resets and option to modify the color of the baselines (vertical line & zero line).
- Changed how enabling/disabling of exchanges is handled
- Added ignore_invalid_symbol = true for error handling where the volume delta data is requested.
Notas de Lançamento
Changes in Version 3:- Switched to Tradingview's official CVD calculation method because of data inaccuracy and code context issues.
Notas de Lançamento
Changes in Version 4:- Imported the code from the library to reduce reliance on external sources
Data Accuracy Disclosure:
This script uses the same core logic as TradingView’s official Cumulative Volume Delta indicator and aggregates values from multiple perpetual futures tickers as described above.
Because of data limitations on TradingView’s free plan and performance constraints in this "Lite" version, the script infers trade direction by comparing candle opens and closes on a lower timeframe—adding volume to positive or negative totals accordingly.
This method produces a realistic estimation of buying and selling pressure but does not represent exchange-reported tick-level delta data. The results are directionally reliable yet approximate, intended for analytical and comparative purposes rather than precise quantitative measurement.
Script de código aberto
Em verdadeiro espírito do TradingView, o criador deste script o tornou de código aberto, para que os traders possam revisar e verificar sua funcionalidade. Parabéns ao autor! Embora você possa usá-lo gratuitamente, lembre-se de que a republicação do código está sujeita às nossas Regras da Casa.
Aviso legal
As informações e publicações não se destinam a ser, e não constituem, conselhos ou recomendações financeiras, de investimento, comerciais ou de outro tipo fornecidos ou endossados pela TradingView. Leia mais nos Termos de Uso.